Reversal Candlestick Patterns: Spot Trend Changes in Crypto
Reversal candlestick patterns: spot trend changes in crypto
This guide teaches you how to read a possible trend change without treating one candle as a command to trade. You will learn the main bullish and bearish shapes, then apply a confirmation workflow built for crypto’s 24/7 markets, thin weekend liquidity, margin-driven wicks, and frequent false reversals.
What you’ll learn about reversal candlestick patterns
Reversal candlestick patterns are chart formations that appear after an existing uptrend or downtrend and warn that control may be shifting from buyers to sellers, or from sellers to buyers. They do not confirm a new trend alone. You still need trend context, volume, momentum, and a clear invalidation level before trading.
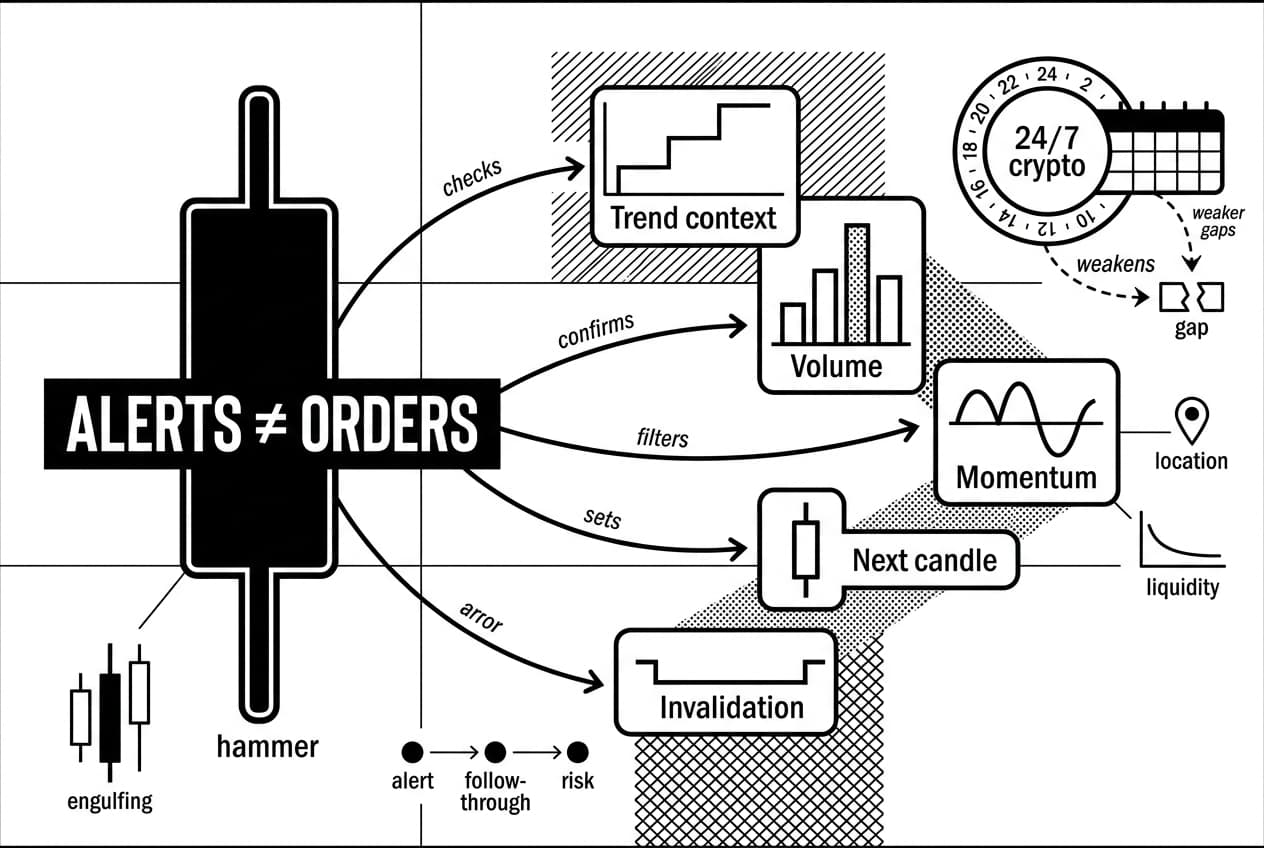
The main lesson is simple: candles are alerts, not orders. A hammer, engulfing candle, or morning star tells you that pressure may be changing. It does not tell you to buy or sell the moment the candle closes.
This matters even more in crypto. Crypto spot markets trade 24 hours a day, 7 days a week (Coinbase, accessed September 2026), so the classic gap-based logic used in stock candlestick books is weaker. You should put more weight on location, volume, next-candle follow-through, and risk placement.
Our take is contrarian but practical: no reverse candle pattern is best on its own. The same hammer that marks a real bottom on a daily bitcoin chart can be a trap on a five-minute low-cap token chart. The candle label matters less than where it forms, how it confirms, and where you are wrong.
For crypto context, this guide follows the kind of cross-checking used by Willy Woo, on-chain analyst, who focuses on separating price moves from network-flow signals. It also reflects the higher-timeframe discipline often emphasized by Lyn Alden, founder of Lyn Alden Investment Strategy, whose public research focuses on structure, liquidity, and macro context rather than one isolated signal.
One historical reminder helps. Bitcoin traded above $69,000 on November 10, 2021 (CoinGecko, November 2021), yet lower-timeframe charts around major highs and lows still printed many candles that looked like reversals before price resolved. That is why this guide teaches a workflow, not memorization.
What you’ll need before reading a reversal candle
Before judging any candle, set up your chart so you are reading the same information every time. You need a candlestick chart, a fixed timeframe, volume bars, support and resistance levels, and one or two confirmation tools such as RSI, an EMA, or VWAP.
On TradingView, open your chosen pair, click the Candles chart type, then click Indicators in the top toolbar. Add volume, relative strength index, and one moving average such as the 21-period EMA. Keep the setup clean. Too many indicators make decisions slower, not better.
The most common beginner error is reading one candle in isolation. A reverse candle pattern only carries useful information when it appears after a real move, near a meaningful level, and with evidence that the other side is taking control.
Know the parts of a candle first
Every candle has four data points: the open, close, high, and low. The body shows the distance between open and close. A green body means price closed above the open. A red body means price closed below the open.
The thin lines above and below the body are wicks. The upper wick shows how high price traded before sellers pushed it back. The lower wick shows how low price traded before buyers pushed it back up.
Long wicks are often the most important part of a reversal candle. They show failed movement. A long lower wick after a selloff means sellers drove price down but could not keep it there. A long upper wick after a rally means buyers pushed up but could not hold the high.
Set your timeframe before you judge the signal
A reversal candle on a five-minute chart is often noise. Crypto can move sharply in short bursts because of liquidations, stop runs, and thin order books. A single small-timeframe candle may show a temporary sweep, not a real trend change.
Start with the 4-hour and daily charts. They carry more weight because each candle contains more trading activity. If you later trade intraday, use the higher timeframe first to decide whether your short-term pattern lines up with the broader structure.
Pro tip: Pick the timeframe before you see the signal. Switching from a 15-minute chart to a 4-hour chart after a candle appears is usually just confirmation shopping.
Step 1: confirm there is a trend to reverse
Before analyzing the candle shape, ask whether price is actually coming from a clear direction. A reversal requires something to reverse. If price has been moving sideways, most reversal candles are just range noise.
Identify a downtrend for bullish reversals
Bullish reversal patterns matter only after sellers have already pushed price lower. Look for lower highs and lower lows. Each bounce should fail below the prior bounce, and each drop should undercut the prior low.
Add a 21-period EMA if you want a quick visual check. If price keeps closing below it and the EMA slopes down, the market is still in a working downtrend. A close above the most recent lower high is often the first sign that sellers are losing control.
Identify an uptrend for bearish reversals
Bearish reversal patterns need the opposite setting. A shooting star, hanging man, or bearish engulfing candle matters most after buyers have already driven price through higher highs and higher lows.
If price has been closing above a rising EMA, treat the trend as up until structure breaks. A bearish candle at the top of that move is a warning, not a short entry by itself. Wait for confirmation before acting.
Mark support, resistance, and liquidity zones
Reversal candles become more useful near meaningful levels. Mark prior swing highs, prior swing lows, weekly open levels, VWAP, the 200-period moving average, and obvious round numbers where stops often cluster.
In crypto, liquidity zones are especially important. Price often moves beyond an obvious high or low, triggers stop orders, then snaps back. That wick can look like a perfect reversal candle. The key question is whether the next candle confirms or whether price immediately returns to the old direction.
Warning: A candle in the middle of a range is not a clean reversal signal. If you cannot point to a prior trend and a nearby level, pass on the setup.
Use this quick test before moving on: can you draw at least two higher highs and higher lows, or two lower highs and lower lows? Is price near support or resistance? Has the candle closed, not just formed mid-session? If yes, you can judge the pattern.
Step 2: recognize the main bullish reversal patterns
After you confirm a downtrend, look for candle structures that show sellers failing and buyers stepping in. Use the table first, then read the notes below so you understand the pressure behind each pattern.
Pattern | What it looks like | Where it appears | Confirmation clue |
|---|---|---|---|
hammer | Small body near the top with a lower wick at least about 2 times the body | After a downtrend, preferably at support | Next candle closes above the hammer high on rising volume |
inverted hammer | Small body near the low with a long upper wick | After a downtrend | Next candle closes above the body and holds the gain |
bullish engulfing | Green body covers the prior red body | After a selloff or at support | Engulfing candle closes with above-average volume |
morning star | Red candle, small indecision candle, then strong green candle | Near the end of a downtrend | Third candle closes above the midpoint of the first candle |
piercing pattern | Green candle closes above 50% of the prior red body | After a downtrend | Close clearly exceeds the midpoint, not just touches it |
tweezer bottom | Two candles reject the same low | At support after selling pressure | Third candle closes bullish and breaks the short-term high |
bullish harami | Small green body inside the prior large red body | Late in a downtrend | Needs a strong follow-through candle before entry |
Hammer and inverted hammer
The hammer candlestick pattern has a small body near the top of the candle and a long lower wick. Sellers pushed price lower during the period, but buyers recovered most of the move before the close.
The inverted hammer has the long wick above the body. Buyers attempted to lift price, sellers pushed back, but sellers still failed to close price much lower. It is usually weaker than a standard hammer, so the next candle matters even more.
Pro tip: Judge the close, not only the wick. A long lower wick is stronger when price closes near the high. If the close sits near the middle, buyer control is less convincing.
Bullish engulfing, morning star, and piercing pattern
A bullish engulfing candle shows buyers taking back the full body of the previous red candle. It is stronger when it forms at support and closes on higher volume than the recent average.
The morning star is a three-candle shift. First comes selling pressure, then indecision, then a green candle showing buyer control. The third candle should close above the midpoint of the first red candle. If it cannot reclaim that midpoint, the bounce is weak.
The piercing pattern is a two-candle version of the same idea. The green candle should close above 50% of the prior red candle’s body. A close below that midpoint is only a bounce, not a clean piercing pattern.
Tweezer bottom and bullish harami
A tweezer bottom forms when two candles reject the same low. Sellers tested the level twice and failed both times. That matching low becomes a short-term support area.
The bullish harami is quieter. A small green candle inside a large red candle shows selling pressure slowing, but it does not prove buyers are in control. Wait for a third candle to close higher before considering entry.
Pro tip: A tweezer bottom at a major support level with rising volume is different from the same shape in the middle of a range. Location decides whether the pattern matters.
Step 3: recognize the main bearish reversal patterns
Bearish reversal candles appear after a price advance and warn that buying pressure may be fading. Your job is not to short immediately. Your job is to decide whether the candle appears in the right place and whether sellers confirm it.
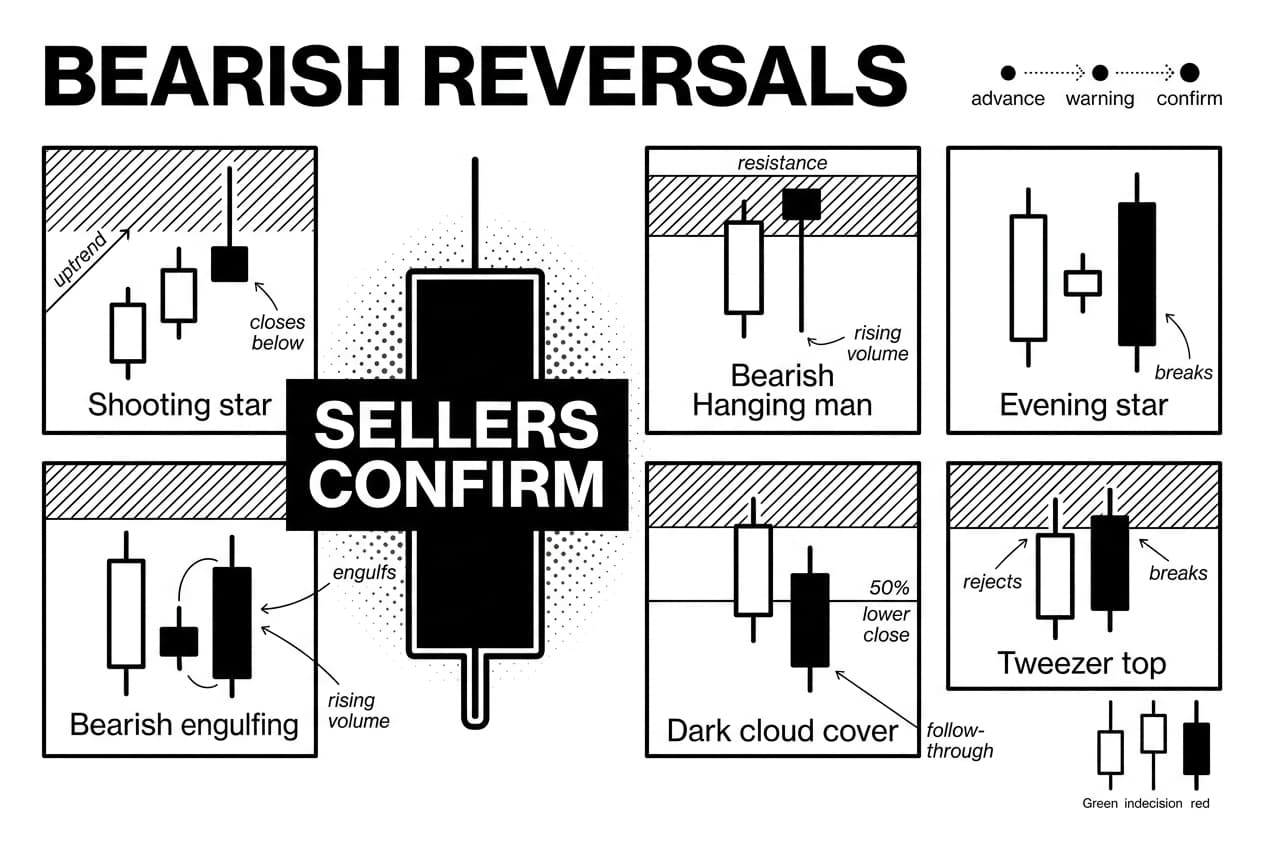
Pattern | What it looks like | Where it appears | Confirmation clue |
|---|---|---|---|
shooting star | Small body near the low with a long upper wick | After an uptrend, preferably at resistance | Next candle closes below the shooting star body |
hanging man | Small body near the top with a long lower wick | After an uptrend | Next candle closes below the hanging man low |
bearish engulfing | Red body covers the prior green body | After a rally or at resistance | Engulfing candle closes on rising volume |
evening star | Green candle, small indecision candle, then strong red candle | Near the end of an uptrend | Third candle closes deep into the first candle body |
dark cloud cover | Red candle closes below 50% of the prior green body | After an uptrend | Close clearly breaks the midpoint |
tweezer top | Two candles reject the same high | At resistance after buying pressure | Second candle closes red, then a lower close follows |
bearish harami | Small red body inside the prior large green body | Late in an uptrend | Needs a strong red follow-through candle |
Shooting star and hanging man
A shooting star has a long upper wick after a rally. Buyers pushed price higher, but sellers forced it back near the open or low. That rejection is the warning.
A hanging man has a long lower wick and appears after an uptrend. It can look similar to a bullish hammer, which is why context matters. You can compare it with the bearish hammer candlestick to see how the same shape changes meaning when it appears after a rally.
If either candle appears on a 4-hour bitcoin chart after a multi-day climb, mark it as a yellow flag. Do not enter until the next candle confirms with a lower close.
Bearish engulfing, evening star, and dark cloud cover
A bearish engulfing candle shows sellers taking control of the full body of the previous green candle. It becomes more useful when it appears at resistance and closes with expanding volume.
The evening star is a three-candle reversal. First comes strong buying, then indecision, then a red candle that closes into the first candle’s body. The deeper the third candle closes, the stronger the shift in pressure.
Dark cloud cover is the two-candle version. The red candle should close below 50% of the prior green candle’s body. If it closes above the midpoint, sellers have not taken enough ground.
Tweezer top and bearish harami
A tweezer top forms when two candles reject the same high. Buyers tried to break resistance twice and failed. In crypto, this often happens near round numbers where orders cluster.
The bearish harami is a pause signal first and a reversal signal second. It shows momentum shrinking, not sellers dominating. Wait for the next candle to close lower before treating it as actionable.
Warning: Crypto uptrends can squeeze short sellers quickly. One bearish candle is not enough. Confirm the trend, mark resistance, wait for follow-through, and decide your invalidation point before placing the trade.
Step 4: confirm the signal before you trade
Spotting a reversal candle is only the first half of the process. Confirmation tells you whether the signal is strong enough to act on. Use the trend-location-confirmation-risk framework every time.
Use volume and follow-through
Volume is the first confirmation check. A bullish engulfing or doji candle pattern on thin volume is weak because the market did not strongly participate.
Wait for the candle to close. Then look for a clean break above the reversal candle’s high for bullish setups, or below its low for bearish setups. Do not enter mid-candle just because the shape looks right.
Check RSI, MACD, EMA, CMF, and VWAP
You do not need every indicator to agree. Two clear confirmations are often enough for a beginner workflow. Keep the rules simple so you can repeat them under pressure.
- RSI divergence: Price makes a new low while RSI makes a higher low, which shows selling pressure may be weakening.
- MACD: A histogram flip or signal-line cross shows momentum is shifting rather than pausing.
- EMA: A close back above the 20-period or 50-period EMA supports a bullish reversal. A rejection from the EMA supports a bearish one.
- CMF: A move above zero during a bullish setup suggests buying pressure is supporting the candle.
- VWAP: A reclaim of daily or weekly VWAP can show price moving back above a fair-value anchor.
For cost planning, use the real fee page for your venue. Binance’s spot schedule lists a 0.1000% maker and taker fee for regular users before discounts (Binance, accessed September 2026). That number matters because small reversal trades can lose their edge after fees.
Apply the trend-location-confirmation-risk framework
Use this three-factor reliability checklist before entering any trade based on a reverse candle pattern:
- Trend and location: Is the pattern appearing after a sustained trend and at a meaningful level such as support, resistance, VWAP, or a prior swing high or low?
- Confirmation: Does at least one momentum or volume clue support the pattern, such as RSI divergence, a MACD shift, VWAP reclaim, or a strong next-candle close?
- Risk-reward and invalidation: Is your stop placed where the pattern is invalidated, and does the setup offer at least 2 units of possible reward for 1 unit of risk?
If a setup clears all three factors, it is worth planning. If it clears only one, leave it alone. If it clears two, place it on a watchlist and wait for more evidence.
Step 5: plan the entry, stop loss, and exit
A reversal signal is not a trade plan. Before you click buy or sell, write down the entry trigger, stop loss, position size, and first target. If you cannot define those four items, skip the trade.
Choose a conservative or aggressive entry
There are three practical entry styles. Pick one before the candle forms so you do not make the choice emotionally.
- Immediate entry: You enter when the signal candle closes. This gives a better price but has the highest false-signal risk.
- Breakout entry: You place a buy stop above the signal candle high for bullish setups, or a sell stop below the signal candle low for bearish setups.
- Retest entry: You wait for price to revisit the pattern level. You may miss trades, but the trades you take often have cleaner risk-reward.
For candlestick patterns for intraday trading, breakout or retest entries usually fit crypto better than immediate entries. Short timeframes produce too many fake closes.
Place your stop where the pattern is invalidated
Your stop should sit where the pattern no longer makes sense. For a bullish hammer, that usually means below the wick low. For a bearish engulfing setup, it usually means above the engulfing candle high.
Crypto needs a small buffer because price often sweeps obvious stops. On liquid pairs, many traders add about 0.3% to 0.5% beyond the wick, then size the position so the dollar risk stays within plan. Do not widen the stop after entry.
If you trade perpetual futures, include funding in the plan. Binance futures funding is exchanged every 8 hours (Binance, accessed September 2026). A trade that looks fine on the chart can become less attractive if you hold it through repeated funding payments.
Set targets before you click buy or sell
Set at least one target before the trade is live. Good targets include the next support or resistance level, the height of the pattern range projected forward, or a trailing stop once price moves in your favor.
Aim for at least a 1:2 risk-reward ratio. If your stop is 1% away, your first target should be at least 2% away. Fees, funding, and slippage all count against that reward.
Warning: Do not move a stop farther away because you still believe in the pattern. Once price breaks the wick or level that defined the setup, the original idea is invalid.
Step 6: find reversal candlestick patterns on charts
Knowing the shapes is useful, but the real skill is finding them consistently before the move is obvious. Build a repeatable scan so every chart gets the same treatment.
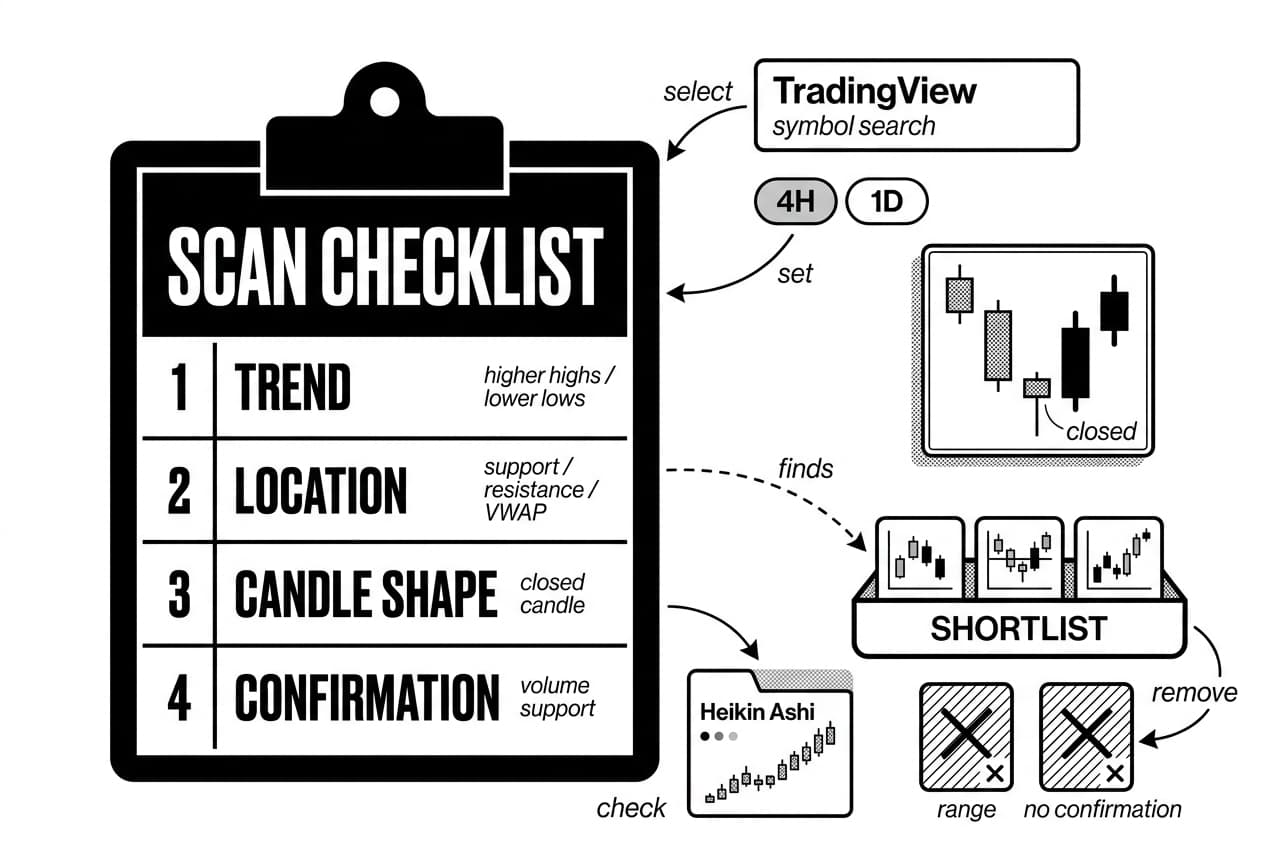
Scan manually with a simple checklist
Open your watchlist and review one pair at a time. On TradingView, use the symbol search box, select the pair, then set the timeframe to 4H or 1D before marking levels.
- Trend: Is there a clear series of higher highs, lower lows, or another directional structure?
- Location: Is price at support, resistance, VWAP, or a major moving average?
- Candle shape: Does the closed candle match a known reverse candle pattern?
- Confirmation: Has the next candle closed in the reversal direction with volume support?
If any answer is no, move to the next chart. You can also place Heikin Ashi candles on a second tab to check whether momentum is smoothing in the new direction.
Use indicators without outsourcing judgment
Auto-labeling scripts can help you find hammers, engulfing candles, and doji formations quickly. They are discovery tools, not trade signals.
An indicator does not know whether a bullish engulfing candle formed at weekly support or in the middle of a range. You still need to run the manual checklist. The label finds the shape; you decide whether the shape matters.
Pro tip: Use automated labels to create a shortlist. Then remove any setup that lacks trend, location, confirmation, or clean risk placement.
Avoid crypto-specific false signals
Crypto charts have traps that do not appear as often in traditional markets. Learn these before you risk money.
- Margin-driven wicks: Forced liquidations can create long wicks that look like reversals but fail within minutes.
- Weekend liquidity: Saturday and Sunday order books can be thinner, so patterns formed on low weekend volume deserve extra caution.
- Low-cap token manipulation: A single large wallet can create a convincing candle on a thin token. Use more caution outside major pairs.
- Questionable volume: Some exchange volume can be noisy. Cross-check major moves with a trusted data source such as CoinGecko, accessed September 2026.
- Thin order books: If depth is shallow, a small order can move price enough to paint a misleading candle.
A high-volume candle near support is not automatically valid. In crypto, volume can come from forced liquidations or short-term positioning rather than organic demand. Always ask who is likely trapped, where stops are sitting, and whether follow-through appears after the candle closes.
Frequently Asked Questions
- What is the best reversal candlestick pattern?
- No single pattern is universally best. Bullish and bearish engulfing candles, hammers, shooting stars, and morning/evening stars are all widely watched. Reliability depends on where the pattern forms, the trend context, supporting volume, timeframe, and whether a confirmation candle follows before entry.
- What is the 3 candle rule?
- The 3 candle rule means waiting for a three-candle sequence — setup, signal, and follow-through — before trusting a reversal. Rather than jumping in on the first candle, traders look for the third candle to confirm that momentum has actually shifted and the move has substance behind it.
- What is the most powerful candlestick pattern?
- Multi-candle patterns like engulfing setups and morning or evening stars are generally considered the most powerful because they demonstrate a clear shift in who controls price. Their reliability increases significantly when they form at major support or resistance levels alongside strong, expanding volume.
- What does the 3-candle reversal pattern indicate?
- A 3-candle reversal pattern signals that momentum may be transferring from sellers to buyers, or vice versa. Classic examples include the morning star and evening star formations. Even so, traders should wait for confirmation beyond the third candle before assuming the prior trend has definitively ended.
- What are the top 5 reversal candlestick patterns?
- Five widely followed reversal patterns are the hammer, shooting star, bullish engulfing, bearish engulfing, and morning/evening star. Each is popular for good reason — they visually show price rejection, buyer or seller exhaustion, or a decisive change in pressure that signals the trend may be turning.
- What is the most powerful reversal pattern?
- The strongest reversal setups combine pattern and context rather than relying on one candle alone. Look for a recognizable pattern forming at a major support or resistance level, backed by volume expansion, momentum divergence, and a closing price that moves clearly beyond the signal candle's range.
- What does a reversal candle look like?
- Reversal candles typically show long wicks that signal price rejection, large real bodies that indicate a sudden shift in control, or engulfing shapes that completely cover the previous candle's body. Multi-candle structures often move from indecision or small bodies into a decisive follow-through candle in the new direction.
- What is an inverted candle?
- An inverted candle has a small real body near its low and a long upper wick, showing that buyers pushed prices higher but sellers regained control by the close. In a downtrend it may act as an inverted hammer hinting at reversal; in an uptrend, the same shape can resemble a shooting star.
Sources
Author

Crypto analyst and blockchain educator with over 8 years of experience in the digital asset space. Former fintech consultant at a major Wall Street firm turned full-time crypto journalist. Specializes in DeFi, tokenomics, and blockchain technology. His writing breaks down complex cryptocurrency concepts into actionable insights for both beginners and seasoned investors.