Moving Average Indicator: SMA vs EMA for Crypto Traders
Moving average indicator: SMA vs EMA for crypto traders
This comparison explains how the simple moving average and exponential moving average behave in crypto markets. The key question is not which moving average indicator is universally better. It is whether you need a slower trend filter, a faster timing tool, or a structured way to use both without overreacting to noisy candles.
SMA vs EMA: quick crypto comparison
The moving average indicator comes in two main forms used across crypto charts: the simple moving average (SMA) and the exponential moving average (EMA). Both smooth price data and help define trend direction, but they weight historical candles differently. That matters in crypto because trading runs continuously, including weekends, thin books, and sudden margin liquidation moves.
Criterion | SMA | EMA |
|---|---|---|
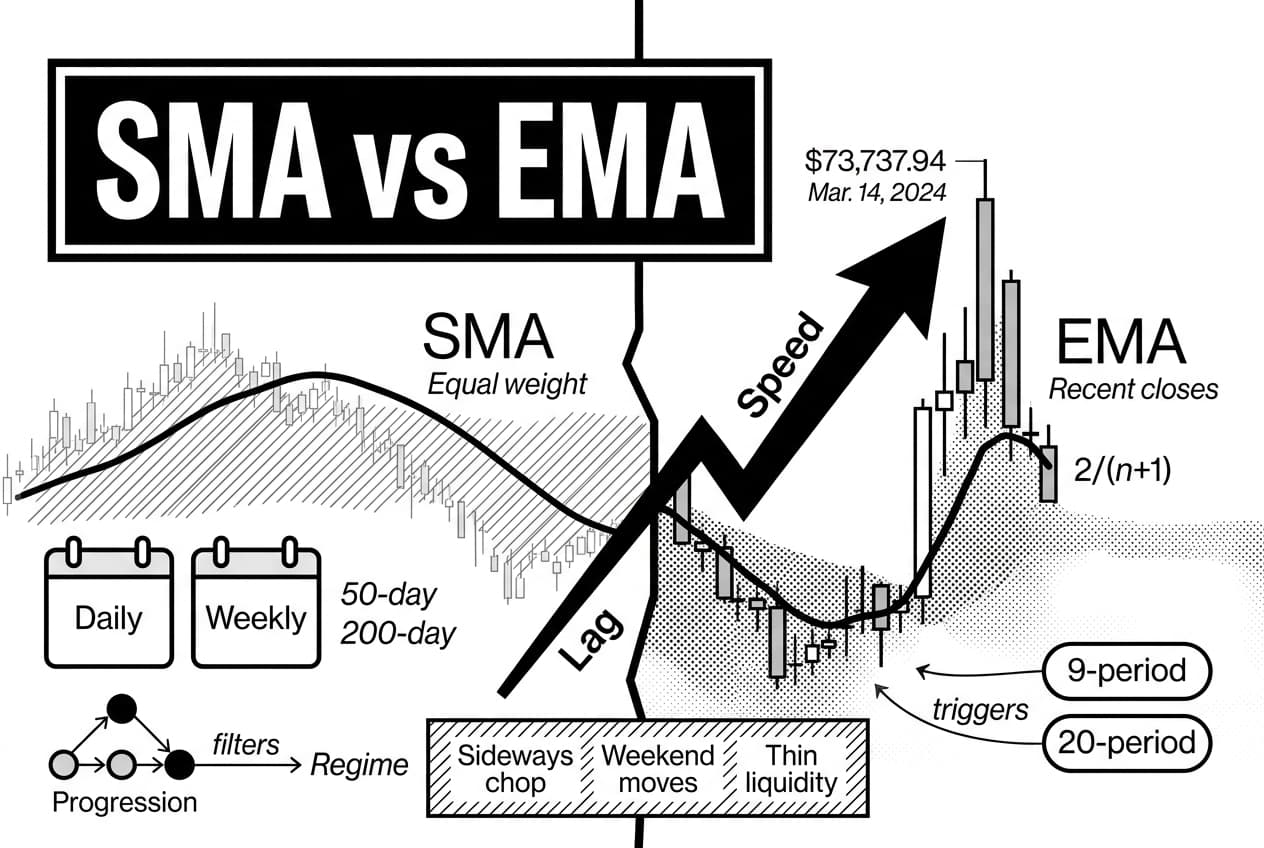
Formula | Sum of closes divided by period count | Previous EMA plus multiplier times price change; multiplier = 2/(n+1) |
Weighting | Equal weight for every candle in the lookback | Heavier weight on recent closes |
Speed | Slower and smoother | Faster and more reactive |
Lag | Higher | Lower, but still lagging |
Best timeframe | Daily and weekly trend checks | Lower-timeframe entries and swing pullbacks |
Common crypto use case | 50-day or 200-day regime filter | 9-period or 20-period momentum trigger |
False-signal risk | Lower in sideways chop, but slower to confirm turns | Higher during wicks, weekend moves, and thin liquidity |
As of Oct. 14, 2026, this guide treats SMA and EMA as tools for different jobs. Bitcoin reached an all-time high of $73,737.94 on Mar. 14, 2024, according to CoinGecko, accessed Oct. 14, 2026. A move of that scale shows why lag, speed, and false signals matter more in crypto than in slower markets.
The common claim is that EMA is better for crypto because it reacts faster. A more useful view is narrower: EMA is better for timing entries in trending conditions, while SMA is often better for avoiding false signals in sideways or low-liquidity conditions. Speed is an advantage only when the market is actually moving with follow-through.
What is a moving average indicator?
A moving average indicator is a lagging technical analysis tool that smooths price data over a chosen number of periods to show trend direction, reduce candle-to-candle noise, and create a moving reference line for support, resistance, entries, and exits on a chart.
How moving averages work
Each time a candle closes, the moving average recalculates. An SMA adds the newest close, removes the oldest close, and divides the total by the number of periods. An EMA also updates with each close, but it gives the newest price more influence through a smoothing multiplier.
This creates a practical difference on real crypto charts. SMA answers, “Where has price spent time across the full lookback?” EMA answers, “How much has recent price action changed the trend read?” Both are backward-looking. Neither predicts the next candle by itself.
What moving averages indicate
When price trades above a moving average, traders often read the trend as constructive. When price trades below it, they often read the trend as weak. The line can also act as a shifting support or resistance area, especially when many traders watch the same period.
Willy Woo, on-chain analyst, maintains public Bitcoin cycle charts that include long-period moving average context. His work is useful here because it frames moving averages as structural reference levels, not as automatic buy or sell commands.
Crossovers are another common use. A shorter average crossing above a longer one can confirm improving momentum. A shorter average crossing below a longer one can confirm fading strength. The limitation is timing: a crossover confirms what price has already done, so it often arrives after the best entry.
Method note: the filter-trigger-fail-safe framework
This article uses a simple decision framework called filter-trigger-fail-safe. The filter decides whether the broader market regime supports the trade. The trigger identifies a possible entry or exit. The fail-safe asks whether liquidity, volume, or candle structure makes the signal too noisy to trust.
- Filter: Use a slower SMA to define market regime.
- Trigger: Use a faster EMA to time a pullback, breakout, or exit.
- Fail-safe: Ignore or reduce confidence in signals that appear during chop, wick-heavy sessions, or weak volume.
Simple moving average: overview, strengths, and weaknesses
The SMA is the baseline moving average indicator. It is transparent, easy to audit, and widely watched on Bitcoin and Ethereum charts. Its strength is stability. Its weakness is that it can react too slowly when crypto moves sharply.
SMA formula and example
The formula is direct: add the closing prices for n periods, then divide by n.
SMA = (P1 + P2 + P3 + ... + Pn) / n
Replicable calculation transcript using five hypothetical BTC closes:
Candle | Close | Included in 5-period SMA? |
|---|---|---|
1 | $60,200 | Yes |
2 | $61,500 | Yes |
3 | $59,800 | Yes |
4 | $62,100 | Yes |
5 | $63,400 | Yes |
The calculation is ($60,200 + $61,500 + $59,800 + $62,100 + $63,400) / 5 = $61,400. Every close receives the same weight. The latest candle counts no more than the first candle in the lookback window.
SMA strengths
Because each period is equally weighted, the SMA produces a smoother line than the EMA at the same period setting. That makes it useful for identifying broader structure rather than reacting to every breakout attempt. The 50-day and 200-day SMA are common trend references because they are slow enough to filter much of the intraday noise.
- Broad trend filter: SMA helps define whether the market is trading above or below an important average price zone.
- Cleaner support and resistance read: Long-period SMAs are less likely to bend sharply because of one wick.
- Easy backtesting: Equal weighting makes the signal simple to reproduce and compare across assets.
The main benefit is not precision. It is discipline. A trader using the 200-day SMA is usually asking a regime question: is the asset acting like it is in a long-term uptrend or a long-term downtrend?
SMA weaknesses
SMA is slower by design. In a fast crypto reversal, the price can move far before the average confirms the change. That can mean late entries during breakouts and late exits during selloffs. This is especially relevant for altcoins, where liquidity can thin quickly outside peak trading hours.
SMA also has drop-off distortion. When a large candle exits the lookback window, the average can shift even if recent closes are stable. That can create a signal that looks meaningful but is partly caused by old data leaving the calculation.
- Late entries and exits: Signals often appear after the strongest part of the move has started.
- Lower short-term usefulness: SMA can be too slow for scalping and intraday momentum trades.
- Window effects: A large old candle leaving the calculation can move the average without new momentum.
Exponential moving average: overview, strengths, and weaknesses
The EMA changes the weighting method. Instead of treating every candle equally, it gives more weight to recent closes. That makes it more sensitive to fresh price action, which can be useful in trending crypto markets and risky in sideways markets.
EMA formula and multiplier
The EMA uses a smoothing multiplier: 2 / (n + 1). Each new value is calculated as:
EMA = (current close × multiplier) + (previous EMA × (1 − multiplier))
EMA period | Multiplier | Latest close weight | Typical use |
|---|---|---|---|
9 | 2 / (9+1) | 20.00% | Scalping and intraday momentum |
20 | 2 / (20+1) | 9.52% | Pullback tracking and short swing setups |
50 | 2 / (50+1) | 3.92% | Medium-term trend confirmation |
The 9-period EMA gives the latest close 20.00% weight, the 20-period EMA gives it 9.52%, and the 50-period EMA gives it 3.92%, using the standard EMA formula described by the TradingView help page, accessed Oct. 14, 2026. This is why shorter EMAs bend faster toward the newest price.
EMA strengths
The EMA's main strength is responsiveness. It can identify a shift in momentum earlier than the SMA at the same period length. That matters for crypto traders who enter on pullbacks during active trends or manage exits after a sharp move loses strength.
- Faster momentum read: EMA reacts sooner when recent closes move in one direction.
- Better short-term timing: Traders often use the 9-period or 20-period EMA to track pullbacks during active trends.
- Useful in EMA-based indicators: MACD uses EMAs, so understanding EMA behavior helps interpret MACD signals.
EMA is most useful when price is trending with follow-through. If Bitcoin or a liquid altcoin breaks out, retests a fast EMA, and holds it with improving volume, the signal is more informative than a standalone crossover in the middle of a range.
EMA weaknesses
The same speed that makes EMA useful can also make it noisy. In crypto, one wick can pull a short EMA toward price and create a false breakout or breakdown signal. This is common during range-bound sessions, weekend trading, and thin altcoin books.
That risk is the reactivity trap: a fast indicator can feel more accurate because it moves sooner, but early movement is not the same as reliable confirmation. A trader who follows every EMA crossover in a sideways market may increase trade count while reducing signal quality.
- Higher whipsaw risk: Short EMAs can flip direction repeatedly in choppy markets.
- More sensitivity to wicks: One unusual candle can distort a lower-timeframe signal.
- Needs confirmation: Volume, candle structure, and market regime matter before acting on the signal.
Key differences between SMA and EMA
SMA and EMA are both lagging tools, but they lag differently. SMA gives a steadier view of the full lookback period, while EMA gives recent price action more control. The right choice depends on whether the trader needs stability or speed.
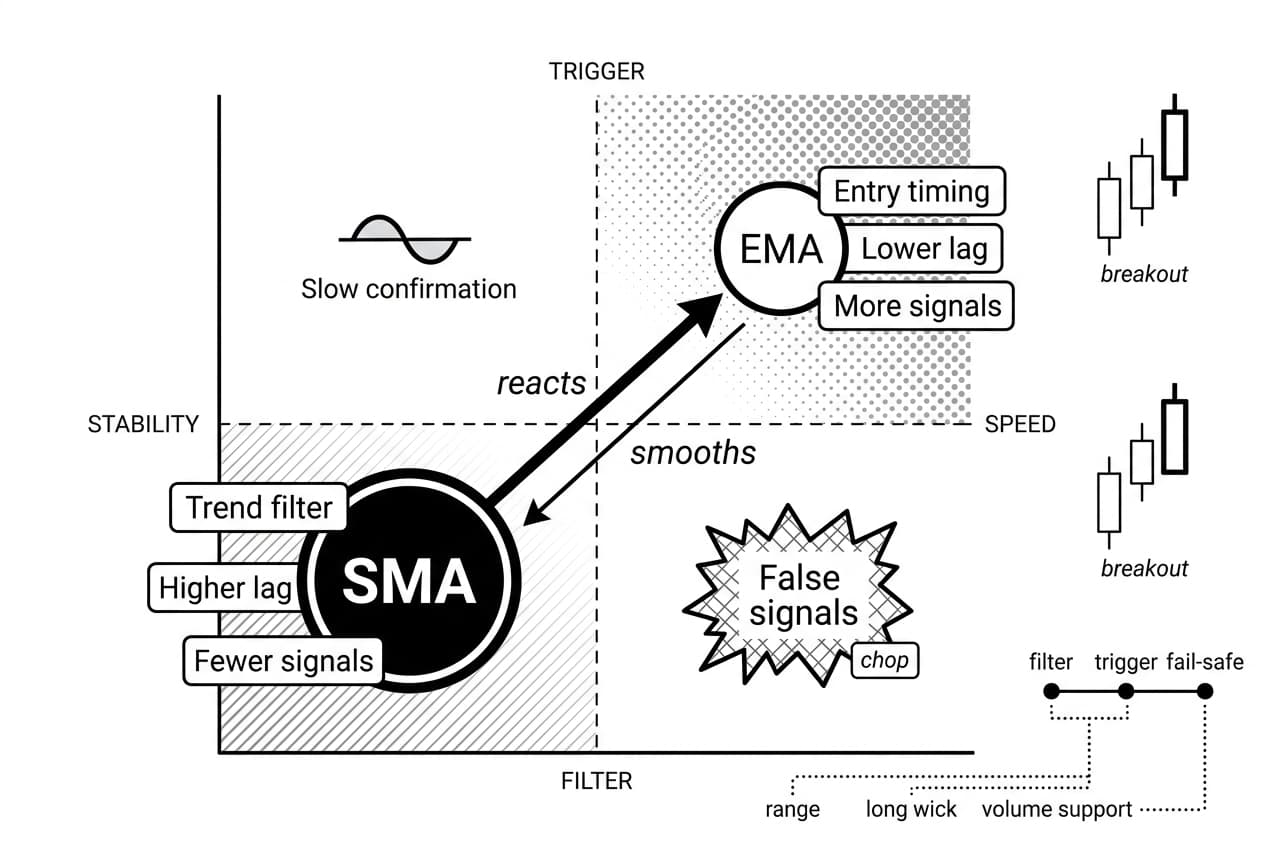
Criterion | SMA | EMA |
|---|---|---|
Lag | Higher because all candles carry equal weight | Lower because recent candles carry more weight |
Smoothness | Higher | Moderate |
Signal frequency | Fewer signals | More signals |
Best role | Trend filter | Entry or exit trigger |
Main weakness | Slow confirmation | False signals in chop |
Responsiveness versus smoothness
EMA reacts faster to new closes, so it can track a breakout earlier. SMA smooths those same closes, so it is less likely to shift because of one unstable candle. Active traders may prefer EMA when the market is trending. Position traders may prefer SMA when the main task is staying aligned with the broader trend.
Trend confirmation versus entry timing
The filter-trigger-fail-safe framework separates the two jobs. Use SMA as the filter when the question is trend direction. Use EMA as the trigger when the question is timing. Then apply the fail-safe: if the signal appears during a range, after a long wick, or without volume support, reduce confidence.
This pairing is often cleaner than forcing one indicator to do every job. For traders who want another structure-based tool beside moving averages, the Ichimoku cloud crypto trading guide covers a different way to evaluate trend, momentum, and support zones.
False signals in crypto volatility
Crypto's continuous trading schedule creates conditions that traditional market examples do not always capture. Thin weekend order books, exchange-specific wicks, and rapid margin liquidations can all push price through a moving average before the move reverses.
EMA is more exposed to that problem because it responds faster. SMA is less exposed, but it can still lag badly after a real breakout or breakdown. That is why the better question is not “which line is best?” but “what market condition is this line being asked to measure?”
Lyn Alden, founder at Lyn Alden Investment Strategy, publishes long-form Bitcoin and macro research that separates structural context from short-term market noise. That distinction is directly relevant to moving average use: long-term averages are better for context, while short-term averages are better for timing.
How crypto traders use moving averages on real charts
Traders use moving averages for support and resistance, trend confirmation, crossover analysis, and momentum checks. The signal quality depends on timeframe, asset liquidity, and whether the market is trending or ranging.
Support and resistance
The 20-period, 50-period, 100-period, and 200-period moving averages are often treated as zones rather than exact lines. A clean bounce with strong candle structure carries more weight than a wick that briefly touches the average and reverses. Pairing the reaction with crypto candlestick signals can add confirmation before a trade.
For example, a long-position setup is more credible when price is above a rising 200-day SMA, pulls back toward a rising 20 EMA, and then closes back above that EMA with improving volume. The SMA defines regime. The EMA helps time the entry. The candle confirms whether buyers defended the level.
Golden cross, death cross, and crossovers
A golden cross occurs when a shorter moving average crosses above a longer moving average, often the 50-day crossing above the 200-day. A death cross is the reverse. These signals receive attention because they simplify trend direction, but they are late by construction.
Bitcoin's widely followed moving-average signals are usually better as confirmation than as first entries. By the time a crossover appears, price may already have moved far from the prior range. Combining crossovers with reversal candlestick patterns can help filter weak signals during sideways markets.
Moving averages and MACD
MACD is built from EMAs. The standard setup subtracts a 26-period EMA from a 12-period EMA, then plots a 9-period EMA of that line as the signal line. Because it uses EMAs, MACD responds faster than an SMA-based tool would.
MACD should still be checked against context. A bullish MACD crossover under a falling 200-day SMA is weaker than the same crossover above a rising long-term average. If RSI is already extended, the trade may also carry higher reversal risk.
Best moving average periods for crypto: 9, 20, 50, and 200
Period selection often matters as much as the SMA-versus-EMA decision. Short periods react quickly and create more signals. Long periods react slowly and create fewer signals. The table below maps common settings to practical crypto use cases.
Period | Type commonly used | Typical timeframe | Primary use | Main weakness |
|---|---|---|---|---|
9 | EMA | 1-minute to 4-hour charts | Short-term momentum and scalping entries | Frequent whipsaws in low-volume ranges |
20 | EMA | 15-minute to daily charts | Pullback tracking and swing entries | Noisy during sideways consolidation |
50 | SMA or EMA | 4-hour to daily charts | Medium-term trend direction | Lags fast reversals |
200 | SMA | Daily to weekly charts | Long-term trend bias | Offers little short-term timing precision |
9 EMA and 20 EMA: short-term momentum and pullback tracking
The 9 EMA is fast enough for lower-timeframe momentum. The 20 EMA is slower and often works better as a pullback guide during active trends. When price holds above a rising 20 EMA on a 1-hour or 4-hour chart, many traders read that as short-term trend strength.
The weakness is range trading. During a sideways period, the 9 EMA and 20 EMA can cross repeatedly without a useful directional move. In that setting, the fail-safe part of the framework matters: do not treat a crossover as valid unless the broader structure, volume, and candle close support it.
50 SMA, 50 EMA, and 200 SMA: medium- and long-term trend analysis
The 50-period average is a middle ground. The 50 EMA reacts faster, while the 50 SMA is smoother. Traders often compare price against both to judge whether a short-term pullback is happening inside a healthy trend or whether the trend is weakening.
The 200-day SMA is the common long-term reference. It is not a precise entry tool, but it frames the market regime. If price is above a rising 200-day SMA, long setups have a stronger trend backdrop. If price is below a falling 200-day SMA, short-term rallies require more caution.
Which moving average indicator should you choose?
There is no single correct choice. The right moving average indicator depends on the job: trend filtering, timing, range avoidance, or combined analysis. Use case matters more than indicator loyalty.
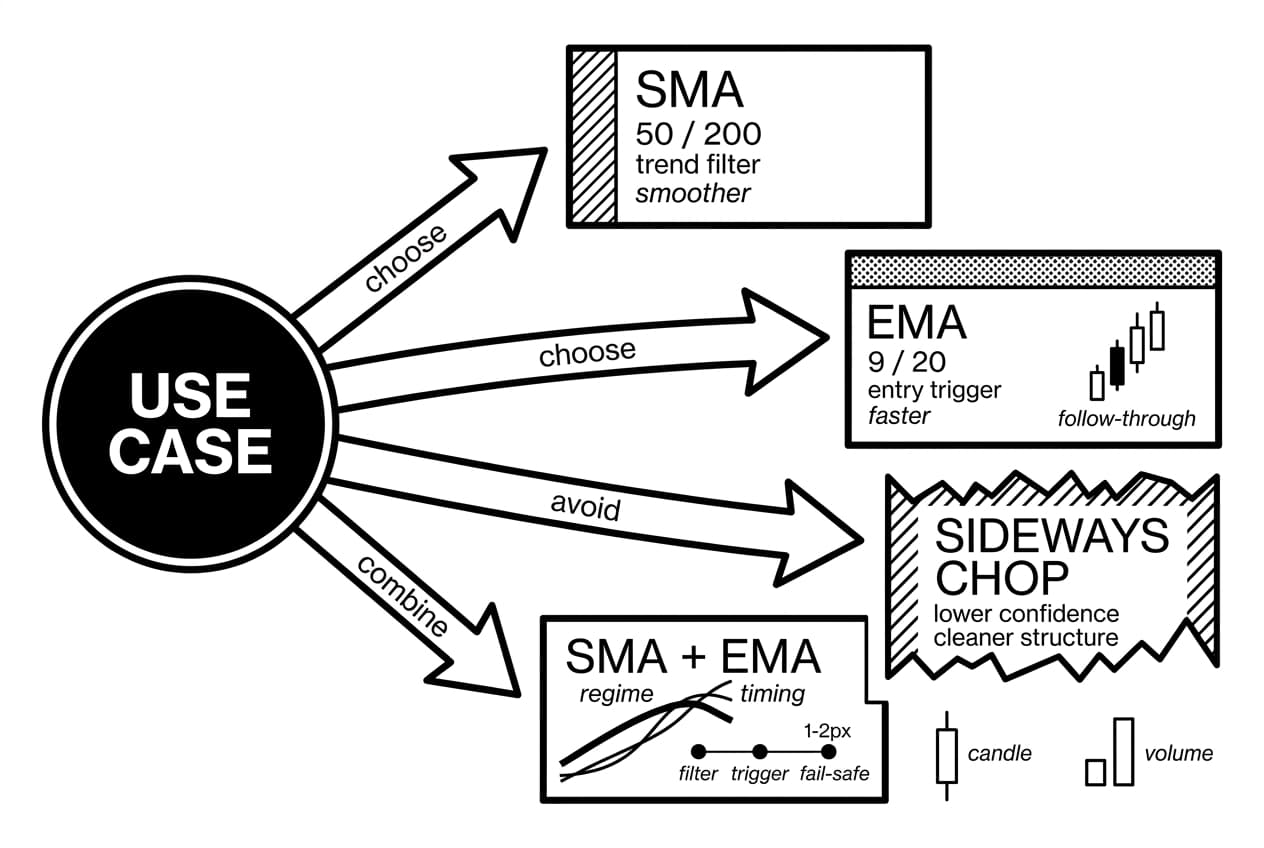
- Long-term trend filter: Choose SMA, especially the 50-period or 200-period version, because it is smoother and less reactive to single candles.
- Short-term momentum entries: Choose EMA, especially the 9-period or 20-period version, because it responds faster to recent price changes.
- Sideways markets: Avoid relying on either average alone. Reduce signal confidence and wait for cleaner structure, or pair the signal with bullish candle pattern signals.
- Combined SMA plus EMA strategy: Use SMA as the regime filter, EMA as the entry trigger, and candle or volume behavior as the fail-safe.
Choose SMA if:
Choose SMA if you are a long-term investor, position trader, or lower-frequency swing trader. It is best when the main task is identifying broad trend direction and avoiding overreaction to normal volatility. Its slower response is a cost, but that cost can also protect against weak signals.
Choose EMA if:
Choose EMA if you trade short-term momentum, active pullbacks, or intraday trend continuation. It is best when timing matters and the market is already showing directional follow-through. Its faster response helps with entries, but it also demands stricter confirmation during choppy sessions.
Use both if:
Use both if you want structure and timing in the same plan. A practical setup is a 200-day SMA for regime, a 20 EMA for pullbacks, and candle confirmation before execution. That approach avoids asking one moving average indicator to solve every trading problem.
Frequently Asked Questions
- What is the best moving average indicator?
- There is no single best moving average indicator. SMA works well for identifying smoother, long-term trend context, while EMA suits faster, short-term signals in volatile crypto markets. Test different settings across timeframes and always combine moving averages with other tools rather than relying on them alone.
- Which is better, 20 EMA or 50 EMA?
- Neither is universally better. The 20 EMA reacts more quickly to price changes, making it useful for short-term momentum trades and pullback entries. The 50 EMA moves slower and is better suited for confirming medium-term trends. Most traders use both together to get a fuller picture of market direction.
- What is 9 EMA and 20 EMA?
- The 9 EMA and 20 EMA are exponential moving averages calculated over the last 9 and 20 price periods. The 9 EMA is more sensitive and reacts quickly to short-term price shifts, while the 20 EMA is smoother and commonly used to gauge short-term trend direction in crypto trading.
- Which indicator is better, EMA or MA?
- EMA is actually a type of moving average, so the real comparison is EMA versus SMA. EMA gives more weight to recent prices, making it faster and more responsive for active crypto trading. SMA treats all periods equally, producing smoother output. The better choice depends entirely on your trading strategy and timeframe.
Sources
Author

Crypto analyst and blockchain educator with over 8 years of experience in the digital asset space. Former fintech consultant at a major Wall Street firm turned full-time crypto journalist. Specializes in DeFi, tokenomics, and blockchain technology. His writing breaks down complex cryptocurrency concepts into actionable insights for both beginners and seasoned investors.