Bullish Candle Pattern Guide: Spot Crypto Buy Signals 2026
Bullish candle pattern guide: spot crypto buy signals in 2026
By the end of this guide, you will know how to read a bullish candle pattern as a trade setup, not as an automatic buy order. You will set up a clean crypto chart, confirm the prior trend, identify the candle structure, wait for follow-through, and define risk before you enter.
This guide is educational only. It is not financial advice. Crypto prices can move sharply, and your first job is always to protect capital before looking for upside.
What you’ll learn about bullish candle patterns
A bullish candle pattern is a single candle or group of candles on a price chart that signals potential buyer strength entering the market, but it still requires confirmation through trend context, support, volume, and a follow-through close before you treat it as a possible trade setup.
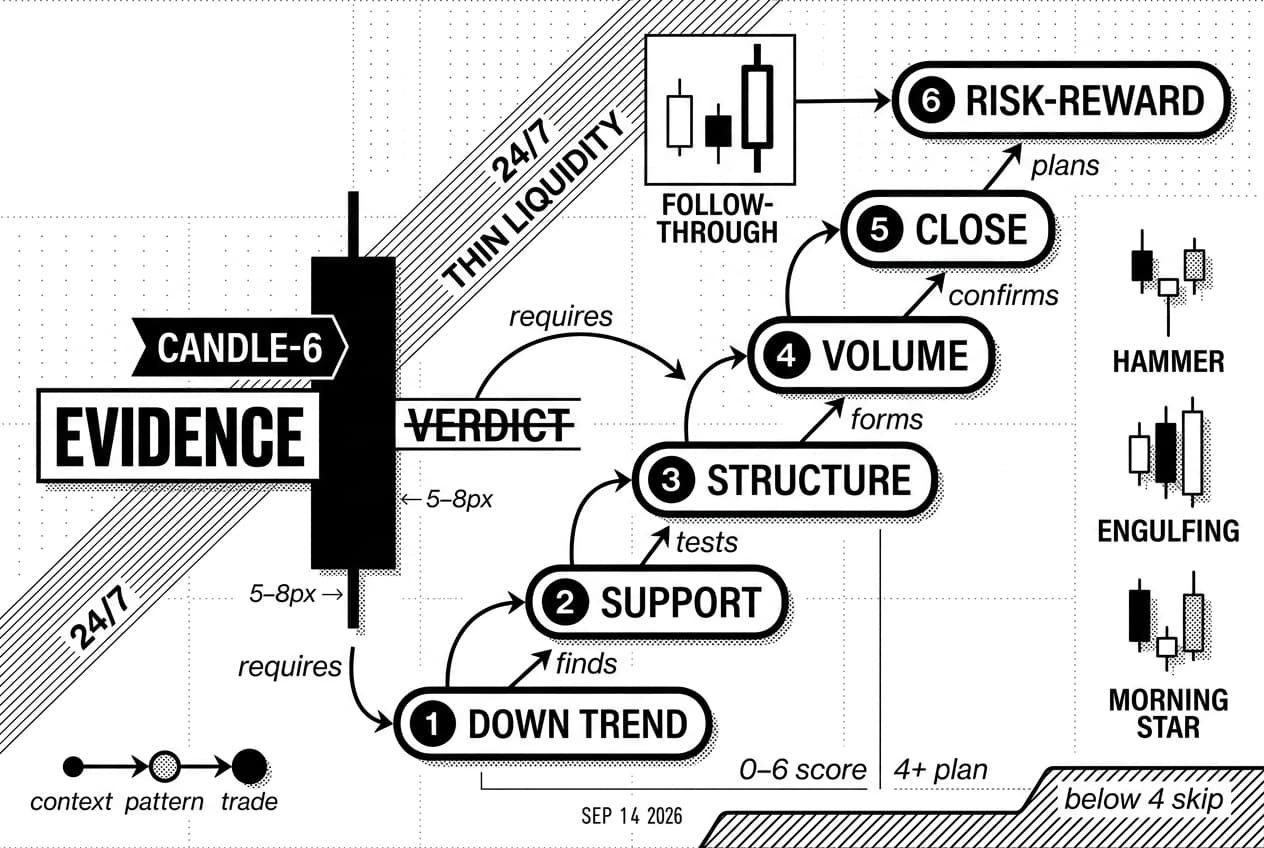
The main idea is simple: a candle is evidence, not a verdict. A hammer, bullish engulfing, or morning star can show that sellers are weakening. It does not prove that the next move will be higher.
As of September 14, 2026, crypto traders still face the same pattern-reading problem that existed during earlier cycles: continuous 24/7 trading creates clean-looking candles during thin liquidity windows. That is why this guide uses a repeatable checklist rather than pattern names alone.
Use the candle-6 framework throughout the guide. Score each setup from 0 to 6 across six checks: prior downtrend, support location, candle structure, volume, confirmation close, and risk-reward. A setup scoring 4 or higher is worth planning. A setup below 4 is usually one to skip.
Willy Woo, on-chain analyst, is useful to cite here because his public work focuses on connecting price action with broader network behavior. The lesson for you is practical: a candle is stronger when it agrees with other market evidence.
Lyn Alden, founder of her macro research firm, often frames bitcoin through liquidity, risk appetite, and market structure. That lens fits this article’s main point: do not read a bullish candle pattern away from the environment around it.
For a dated market reference, bitcoin reached about $73,737 on March 14, 2024, according to CoinGecko, accessed September 14, 2026. Strong trend events like that can make late bullish candles look tempting, but the same candles can be poor entries if your stop is too far away.
The goal: find better buy setups, not perfect predictions
Candlestick patterns show the fight between buyers and sellers during one selected time window. A long lower wick, for example, tells you sellers pushed price down, then buyers forced price back up before the candle closed.
That is useful information. It is not a guarantee. Your job is to ask what would prove the setup wrong before you risk money.
Common framing: a bullish candle pattern is a buy signal. Our take: it is only a buy setup. Without a prior downtrend, volume confirmation, and a clear invalidation level, the same pattern can become liquidity for the next move down.
Prerequisites: set up your chart before you start
Before you identify a bullish candle pattern, make the chart clean enough to read. Use one trading pair, one main timeframe, volume bars, two moving averages, and clearly marked support and resistance levels.
Check your exchange costs before trading. Binance lists standard spot trading rates on its fee page, including a 0.1% maker and taker rate for regular users on many spot pairs, according to the Binance fee schedule, accessed September 14, 2026. Your actual fee can vary by account tier, token discounts, and exchange.
Choose a timeframe that matches your trading style
The timeframe changes what a candle means. A 5-minute hammer may only capture a brief liquidity sweep. A 4-hour hammer shows a longer period of buyer response and usually deserves more attention.
If you are new, start with the 4-hour chart. It is slow enough for planning and fast enough to give you practice during the week. Once your process is consistent, compare it with the daily chart before entering.
Pro tip: Do not change timeframes until the chart says what you want to hear. Pick your main timeframe first, then use higher timeframes only to check support, resistance, and trend direction.
Add volume, moving averages, and support levels
Add three items to your chart: volume bars, the 20-period exponential moving average, the 50-period exponential moving average, and horizontal support or resistance lines. These tools keep your focus on market structure instead of decoration.
chart element | what it shows | why it matters |
|---|---|---|
volume bars | trading activity during each candle | shows whether buyers joined the move |
20-period average | short-term trend pressure | helps you see whether price is still weak |
50-period average | broader trend direction | helps confirm whether the reversal has room |
horizontal levels | prior support and resistance | shows where buyers or sellers reacted before |
Volume is the filter beginners skip most often. A bullish candle pattern on low volume tells you that few participants supported the move. A similar candle with higher volume gives the setup more weight.
Warning: Do not load your chart with ten indicators. More tools can create more conflict. For this process, keep the chart limited to candles, volume, two moving averages, and marked levels.
Step 1: confirm there is a downtrend to reverse
Before you label any candle as a bullish reversal, ask what it is reversing. A bullish candle pattern matters most after a clear decline, a pullback inside a larger uptrend, or a selloff into a known support zone.
Look for lower highs and lower lows
A downtrend usually appears as lower highs and lower lows. Each rally fails below the prior rally, and each selloff pushes to a lower price. That sequence tells you sellers have controlled the market.
If you cannot see prior selling pressure, do not call the next green candle a reversal. It may be only a normal candle inside a sideways range.
You can use the moving averages as a quick check. If price is below the 50-period average and the 20-period average is sloping down, selling pressure is still active. That is where reversal candlestick patterns become worth watching.
Mark the nearest support zone
Location gives the candle meaning. A bullish pattern near a prior demand zone, range low, volume shelf, or round number has more value than the same candle in the middle of a range.
Mark support before the pattern completes. If you draw the level after the candle appears, you may be fitting the chart to your bias instead of testing the setup.
Warning: Do not trade a reversal that has nothing to reverse. If the chart is choppy and directionless, skip the setup. Your patience is part of your edge.
Step 2: identify single-candle bullish patterns
Once you confirm the downtrend, read the individual candle. Every candle has an open, high, low, and close. The body shows the distance between open and close. The wicks show how far price traveled before the candle finished.
Read the hammer and inverted hammer
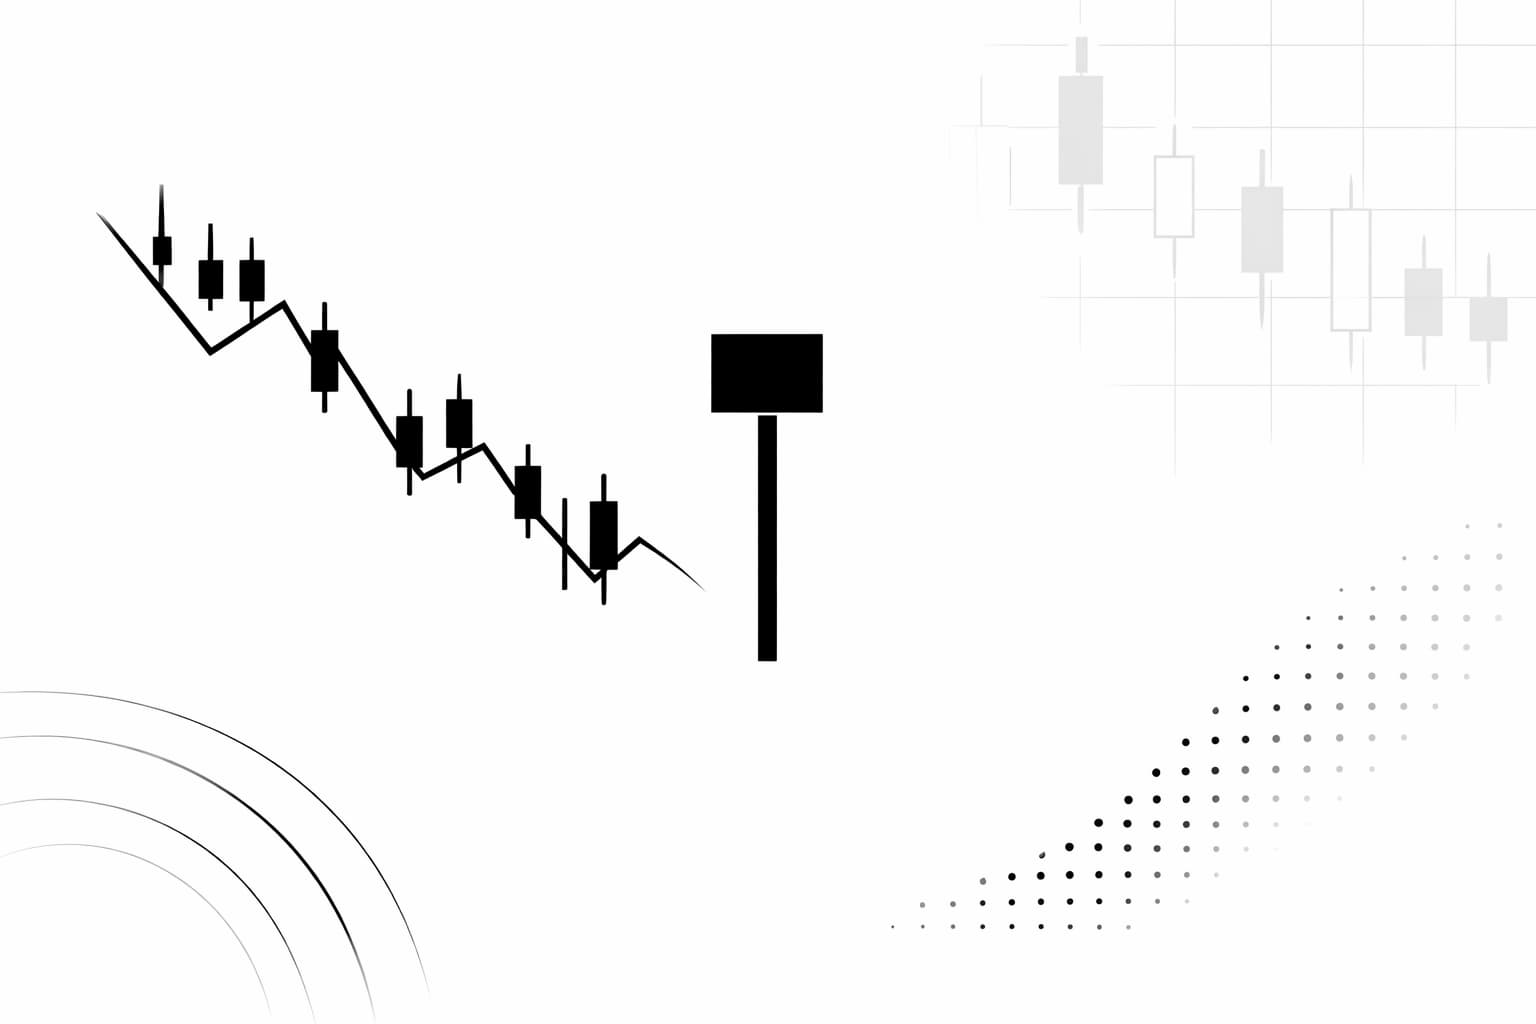
The hammer candlestick pattern has a small body near the top of the candle and a lower wick at least twice the body’s length. It shows that sellers pushed price down, but buyers rejected the low before the close.
The inverted hammer has a small body near the bottom and a long upper wick. It can still matter near support, but it needs stronger follow-through because the candle did not close near the high.
Spot the bullish belt hold
A bullish belt hold opens near the candle low and closes much higher, creating a large green body with little or no lower wick. It shows buyers controlled most of that session.
This pattern is strongest when volume is above the recent average and price forms the candle near support. If it forms after a fast rally, treat it as possible exhaustion instead of a fresh reversal.
Use spinning tops and doji candles as caution signals
A spinning top has a small body with upper and lower wicks. A doji candle pattern has an open and close that are nearly the same. Both show indecision, not confirmed buying power.
Near support, these candles can hint that selling pressure is slowing. You still need the next candle to close bullishly before treating the setup as active.
Pro tip: Wait for the candle to close. A candle that looks like a hammer with minutes left can finish as an indecision candle. Label the pattern only after the final close on your selected timeframe.
Step 3: spot multi-candle bullish reversal patterns
Single candles give you one session of information. Multi-candle patterns show how control shifts across several sessions. That extra context helps you avoid reacting to one temporary bounce.
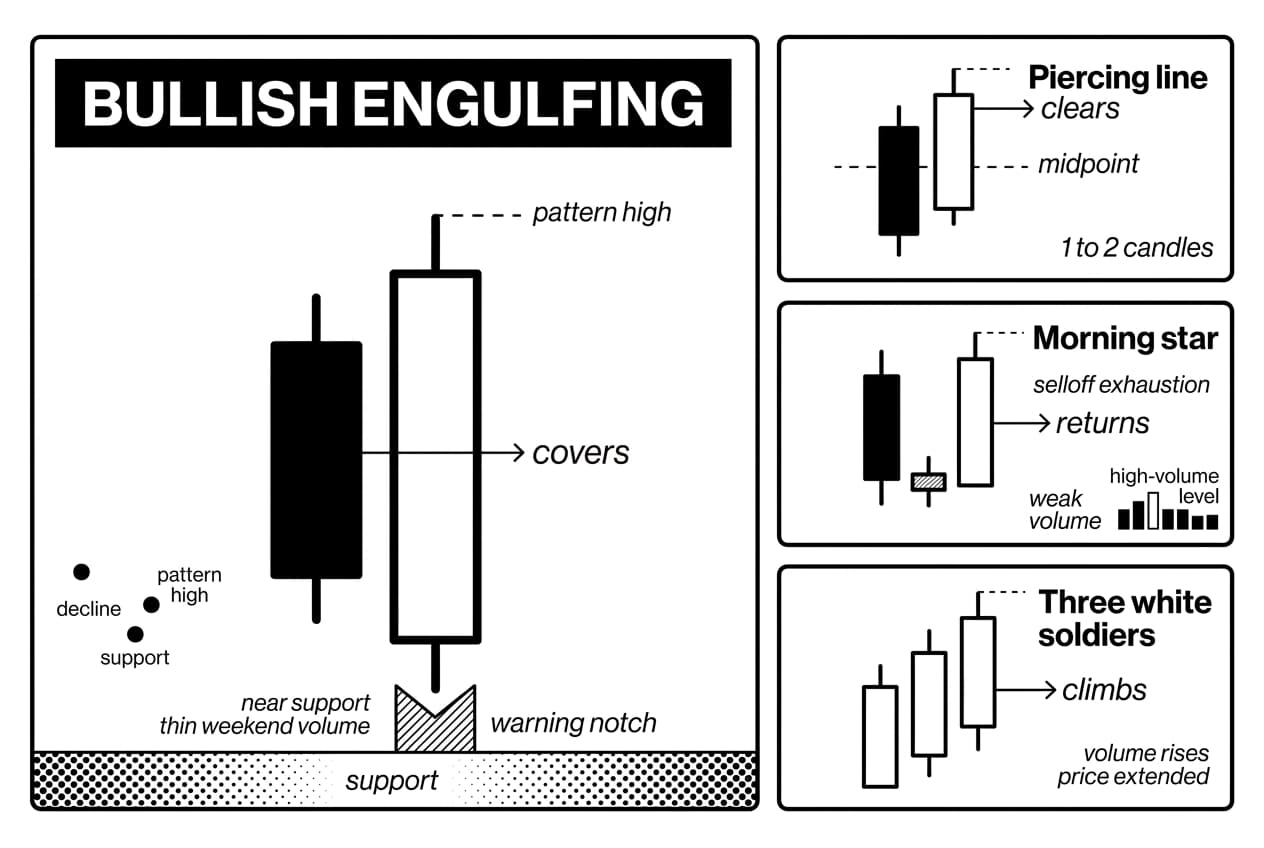
Use this table as your quick comparison when a bullish candle pattern starts to form.
pattern | candle structure | best context | confirmation | common failure sign |
|---|---|---|---|---|
bullish engulfing | large bullish body covers the prior bearish body | end of a short-term decline near support | next candle closes above the pattern high | forms during thin weekend volume |
piercing line | bullish candle closes above the midpoint of the prior bearish body | clear downtrend into support | follow-through close within 1 to 2 candles | close fails to clear the midpoint |
morning star | bearish candle, small indecision candle, strong bullish candle | selloff exhaustion near a high-volume level | third candle closes into the first candle’s body | third candle has weak volume |
three white soldiers | three strong bullish candles closing near their highs | early reversal after a deep decline | volume rises across the sequence | appears after price is already extended |
Master the bullish engulfing setup
The bullish engulfing setup uses two candles. The first candle is bearish. The second candle is bullish and its body fully covers the prior body from open to close.
You want this pattern near a known support level, not in open space. A large bullish body after a multi-day decline can be meaningful. The same structure on a thinly traded weekend candle deserves caution.
Pro tip: Compare the volume on both candles. If the bullish candle does not trade more volume than the bearish candle, buyer conviction may be weaker than the chart shape suggests.
Recognize the piercing line setup
The piercing line setup begins with a bearish candle. The next candle opens weak, then rallies to close above the midpoint of the prior bearish body.
The midpoint matters. A close just below it is not the same setup. Be precise because small differences change the quality score.
Warning: In high-volatility pairs, a candle can briefly cross the midpoint and then fade before the close. Wait for the completed candle before you count the setup.
Use the morning star for turnarounds
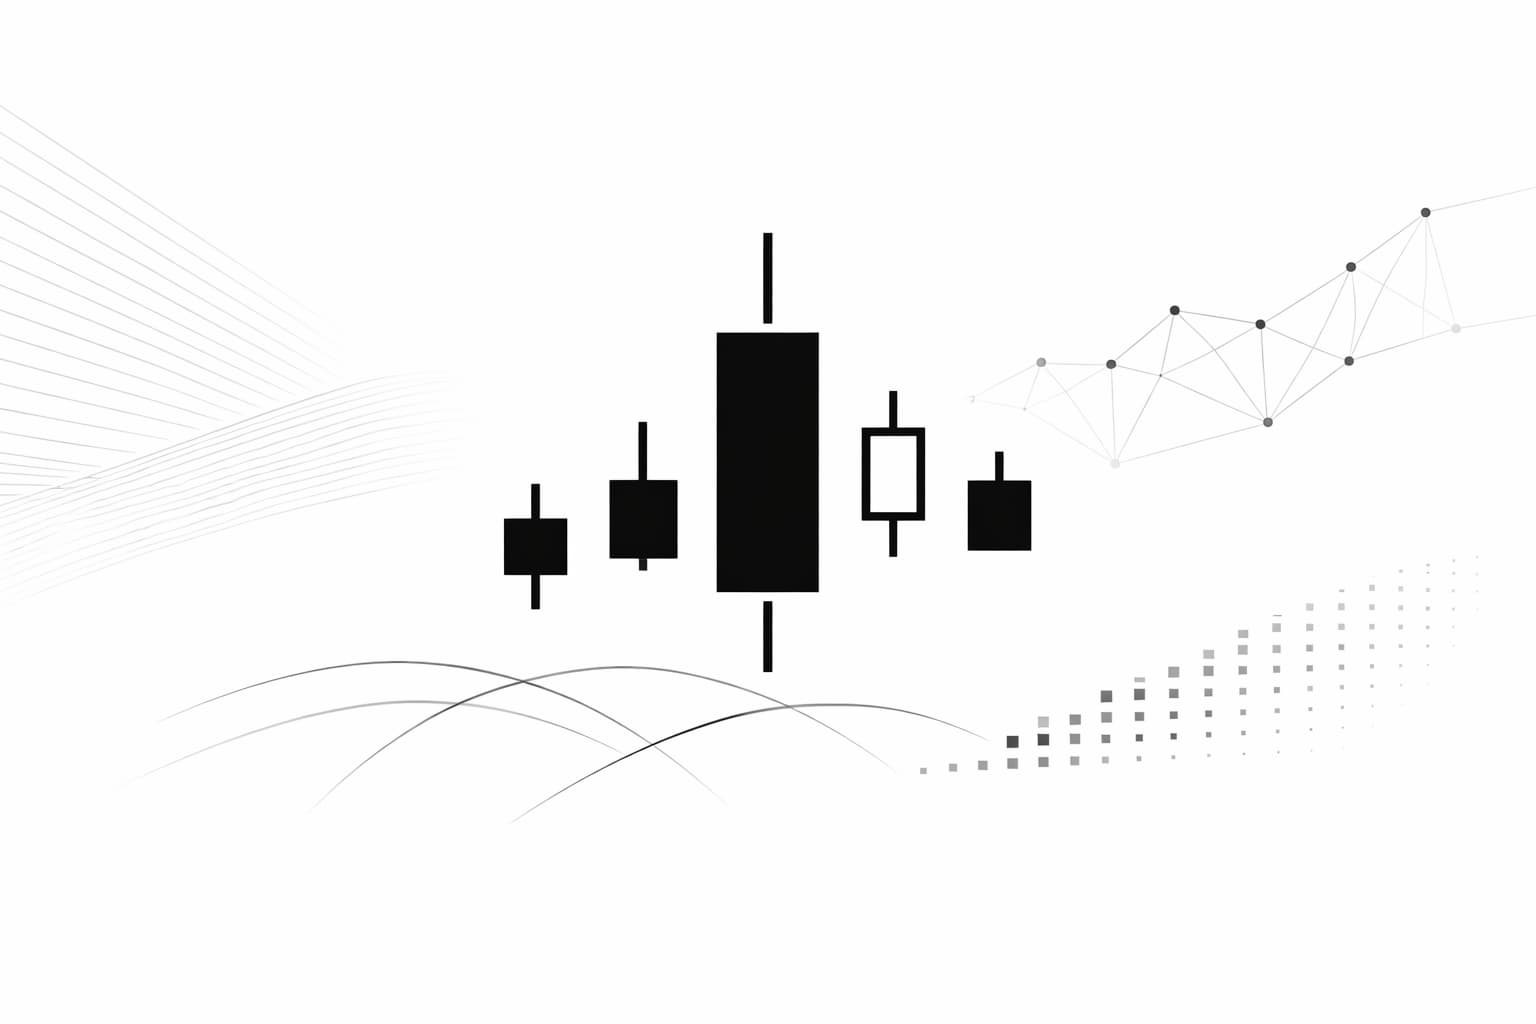
The morning star uses three candles. Candle one shows strong selling. Candle two shows hesitation. Candle three shows buyers taking control with a strong close back into the first candle’s body.
Traditional chart books often mention gaps. Crypto trades continuously, so gaps are less common. Focus on the shift from selling pressure to indecision to buyer control.
Understand the three-candle bullish sequence
The three-candle bullish sequence is three strong bullish candles in a row, each closing near its high. It shows sustained demand rather than a one-candle bounce.
Be careful after a near-vertical move. If the asset has already gained 30% to 40% before the pattern completes, your entry may be late and your stop may be too wide.
Warning: A valid pattern can still be a bad trade. If the entry is far above the invalidation level, the math may not work even when the direction is right.
Step 4: rank the pattern by signal quality
Spotting a bullish candle pattern is only half the job. Before you act, rank the setup. The candle-6 score keeps you from treating every pattern as equal.
Compare strong, average, and weak setups
Score one point for each of these: prior downtrend, support location, clean candle structure, above-average volume, confirmation close, and acceptable risk-reward. A 5 or 6 is strong. A 4 is tradable with care. A 3 or lower is usually a pass.
setup quality | example | why it scores that way |
|---|---|---|
strong | hammer at weekly support with volume 40% above the 20-period average | location, wick rejection, and volume agree |
average | bullish engulfing on the 1-hour chart with normal volume | structure is good, but evidence is limited |
weak | small green candle in the middle of a range | no clear level, no strong body, no clear pressure shift |
The 40% volume threshold is not a law. It is a practical filter you can test in your journal. If volume is only average, demand may not be strong enough to carry price through resistance.
Check whether the pattern is too late
A setup can be valid and still arrive too late. If price has already bounced far from the low, your stop below the pattern may be too distant.
This creates poor risk-reward. You may be risking a large loss for a small target. When that happens, skip the entry and wait for a retest.
Pro tip: If you missed the first move, mark the breakout level and wait. Crypto often retests prior levels before continuing, and a patient second entry is usually cleaner than a chase.
Step 5: confirm the buy signal before entering
Before you place a trade, collect follow-through evidence. Confirmation does not remove risk, but it helps filter weak patterns that never attract real buyers.
Run this five-step confirmation checklist before every entry:
- Confirm the downtrend.
- Mark support.
- Wait for close.
- Check volume.
- Define invalidation.
Wait for bullish confirmation
The cleanest confirmation is the next candle closing above the pattern high on the same timeframe. A support reclaim can also count if price dips back to the level and holds.
If you trade with heikin ashi candles, remember that they smooth price action. They can make trends easier to read, but they can also delay your signal.
Use volume to validate buyer pressure
Volume shows participation. A bullish engulfing candle on two times average volume is different from the same pattern on quiet volume. Stronger participation gives the candle more evidence behind it.
You can also check Chaikin money flow. A move above zero during the bullish candle can support the view that capital is flowing into the asset, but it should not replace price and volume.
Combine candles with market structure
A bullish candle pattern gains weight when it aligns with structure. A hammer at support is stronger than a hammer in empty space. A morning star at a reclaimed breakout level gives you more than one reason to plan the trade.
Warning: Confirmation can reduce your reward. Waiting for a close above the pattern high often gives you a safer entry, but it also raises your entry price. Recalculate risk-reward after confirmation, not before.
Step 6: plan the trade with entry, stop, target, and rr
Now convert the pattern into a trade plan. Do this before you click buy. If you cannot write the entry, stop, target, size, and cost check, the setup is not ready.
- Entry trigger: define the exact price action required before entering.
- Stop level: place the stop where the setup is proven wrong.
- Target: choose the nearest meaningful resistance or measured-move level.
- Position size: calculate units so the stop loses only your pre-approved amount.
- Fee and slippage check: subtract expected trading costs before accepting the trade.
Place the entry after a clear trigger
You can use a conservative entry or an aggressive entry. The conservative entry waits for a close above the pattern high. The aggressive entry enters near the pattern close and accepts more failure risk.
If you are new, use the conservative version. Missing a small part of the move is better than training yourself to buy unconfirmed candles.
Pro tip: Set an alert at the confirmation level instead of staring at the chart. In TradingView, click the price scale near your level, choose add alert, and write the setup name in the notes field.
Set the stop where the setup is invalidated
Your stop should sit below the pattern low, the nearest swing low, or the support zone that made the setup valid. That price tells you the bullish idea failed.
A random percentage stop can ignore the chart. A 3% stop may be too tight for one asset and too wide for another. Let the structure define the invalidation point.
Warning: Crypto often wicks below obvious support before reversing. If your plan allows it, leave a small buffer of about 0.5% to 1% below the structural low rather than placing the stop exactly where everyone else can see it.
Calculate risk-reward before you click buy
A 2:1 risk-reward ratio means your planned profit is twice your planned loss. If your stop is $50 below entry, your target should be at least $100 above entry before fees and slippage.
Costs matter. If your exchange charges 0.1% per side and you expect 0.2% slippage, a thin target can disappear quickly. Recheck the fee schedule for your exchange before trading.
For practice, write the plan in a journal before entry: entry price, stop price, target price, dollar risk, candle-6 score, and reason for the trade. This prevents you from moving the stop after the market turns against you.
Step 7: avoid false bullish signals in crypto
False signals are part of crypto trading. Your goal is not to avoid every loss. Your goal is to avoid the obvious traps: low-liquidity candles, overhead resistance, late entries, and missing invalidation.
Watch for low-liquidity wick traps
Small tokens and thin pairs can print dramatic lower wicks without real demand behind them. One large order can create a candle that looks bullish and then fades quickly.
Before acting, compare the candle’s volume with the prior 20 candles. If volume is below average, leave the setup unconfirmed. This is especially important during weekends and holidays.
Warning: A long lower wick on a low-volume small-cap pair is not automatically a hammer. It may be only a wick trap. If the volume does not support the move, pass.
Also confirm you are reading the candle direction correctly. The bearish hammer candlestick can look similar to beginners, but it warns of a different type of pressure.
Do not ignore higher-timeframe resistance
A bullish candle on the 15-minute chart can look perfect until you open the daily chart. If price is directly under a major resistance zone, sellers may be waiting above.
Use the zoom-out test. Before entering, check at least two higher timeframes and mark visible resistance. If your entry sits within 1% to 2% of a major resistance zone, skip or reduce size.
Use a trading journal
No guide can tell you which setups work best for your temperament, timeframe, and pairs. Your journal can. Track every bullish candle pattern you take and every one you skip with a short reason.
Record the pattern type, timeframe, entry, stop, target, risk-reward, confirmation method, candle-6 score, and outcome. After 30 to 50 logged trades, you will see which setups fit your style.
For replay practice, TradingView explains how to step through candles with bar replay in its help center, according to TradingView, accessed September 14, 2026. Paper-trade at least 20 setups before risking real capital.
Frequently Asked Questions
- What is the most bullish candle pattern?
- Traders commonly rank the bullish engulfing, morning star, and three white soldiers among the strongest setups. That said, no single pattern wins every time. Reliability depends on the prior downtrend, nearby support, volume confirmation, and whether the risk-reward ratio makes the trade worth taking.
- What is the 3 candle rule?
- The 3 candle rule is a confirmation approach where traders wait for a three-candle sequence — or multiple closes in the same direction — before trusting a reversal signal. It is not a universal law. Always combine it with trend analysis, volume, and key support levels for stronger results.
- Is a bullish candle red or green?
- A bullish candle is typically displayed as green or white, meaning the price closed higher than it opened. However, chart colors are fully customizable on most platforms. Focus on the relationship between the open and close rather than color alone to avoid misreading signals.
- How do you identify bullish price action?
- Bullish conditions generally show higher highs, higher lows, strong candle closes near session tops, rising volume, and price holding support or breaking resistance. Individual candlestick patterns carry more weight when these broader market factors align, giving you a more complete picture before entering a trade.
Sources
Author

Crypto analyst and blockchain educator with over 8 years of experience in the digital asset space. Former fintech consultant at a major Wall Street firm turned full-time crypto journalist. Specializes in DeFi, tokenomics, and blockchain technology. His writing breaks down complex cryptocurrency concepts into actionable insights for both beginners and seasoned investors.