Hammer Candlestick Pattern: Bullish Reversal Trading Guide
Hammer candlestick pattern: bullish reversal trading guide
What is a hammer candlestick?
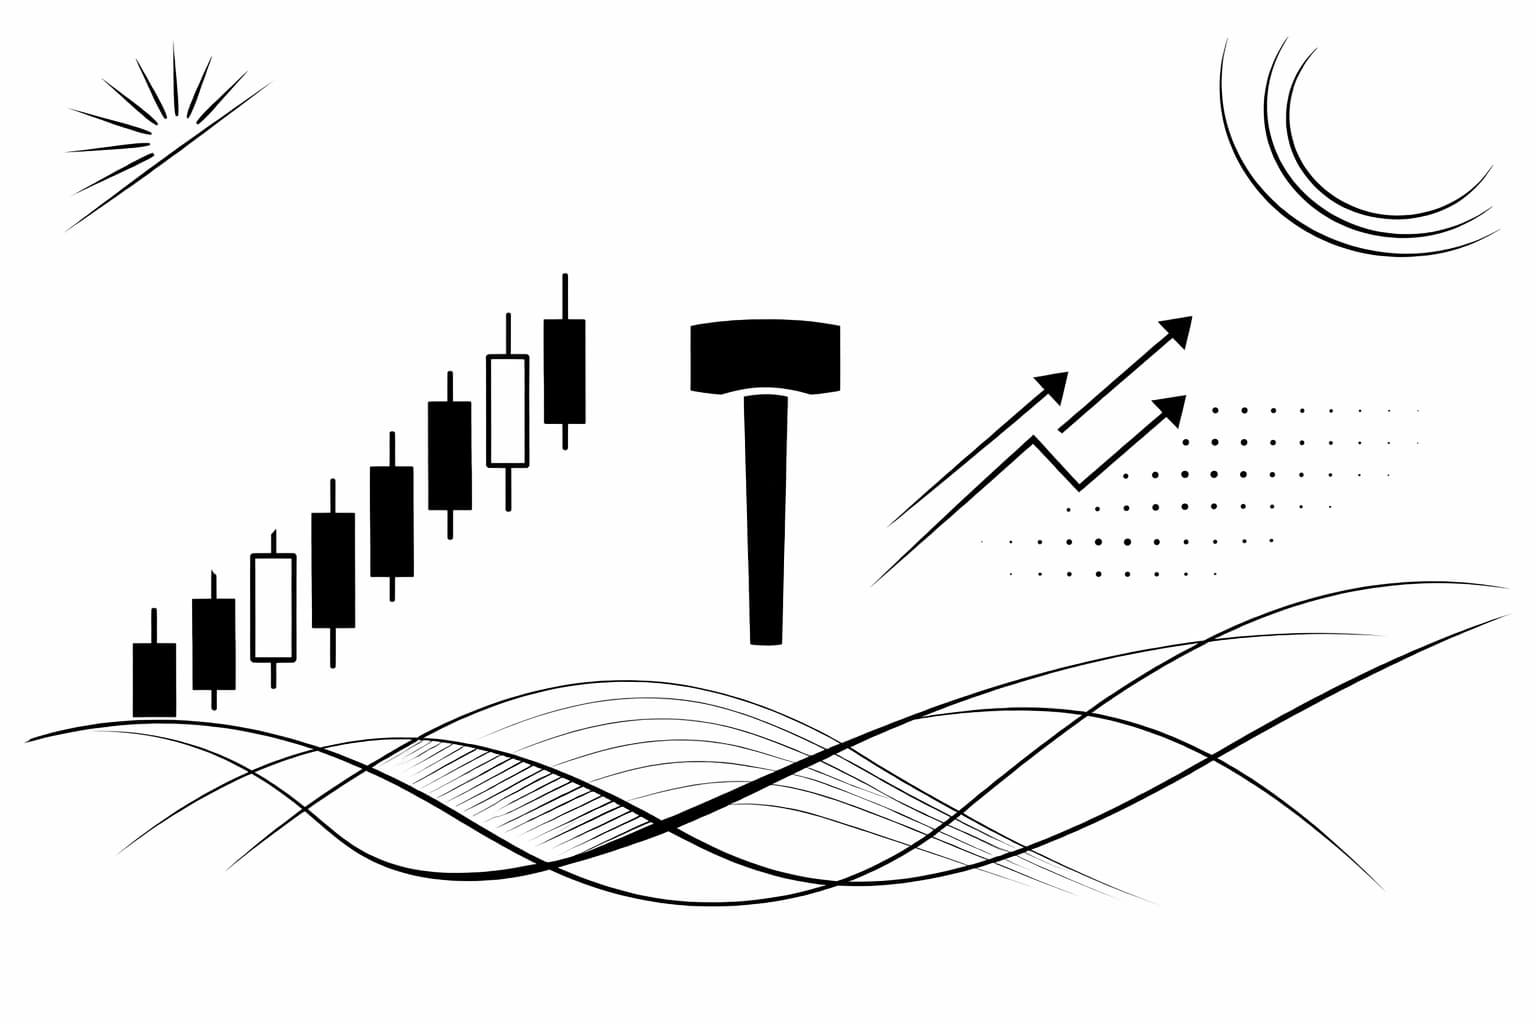
A hammer candlestick is a single-candle chart pattern with a small body near the top of its range and a long lower shadow. It shows that sellers pushed price sharply lower, buyers recovered most of the drop, and a possible bullish reversal may be forming.
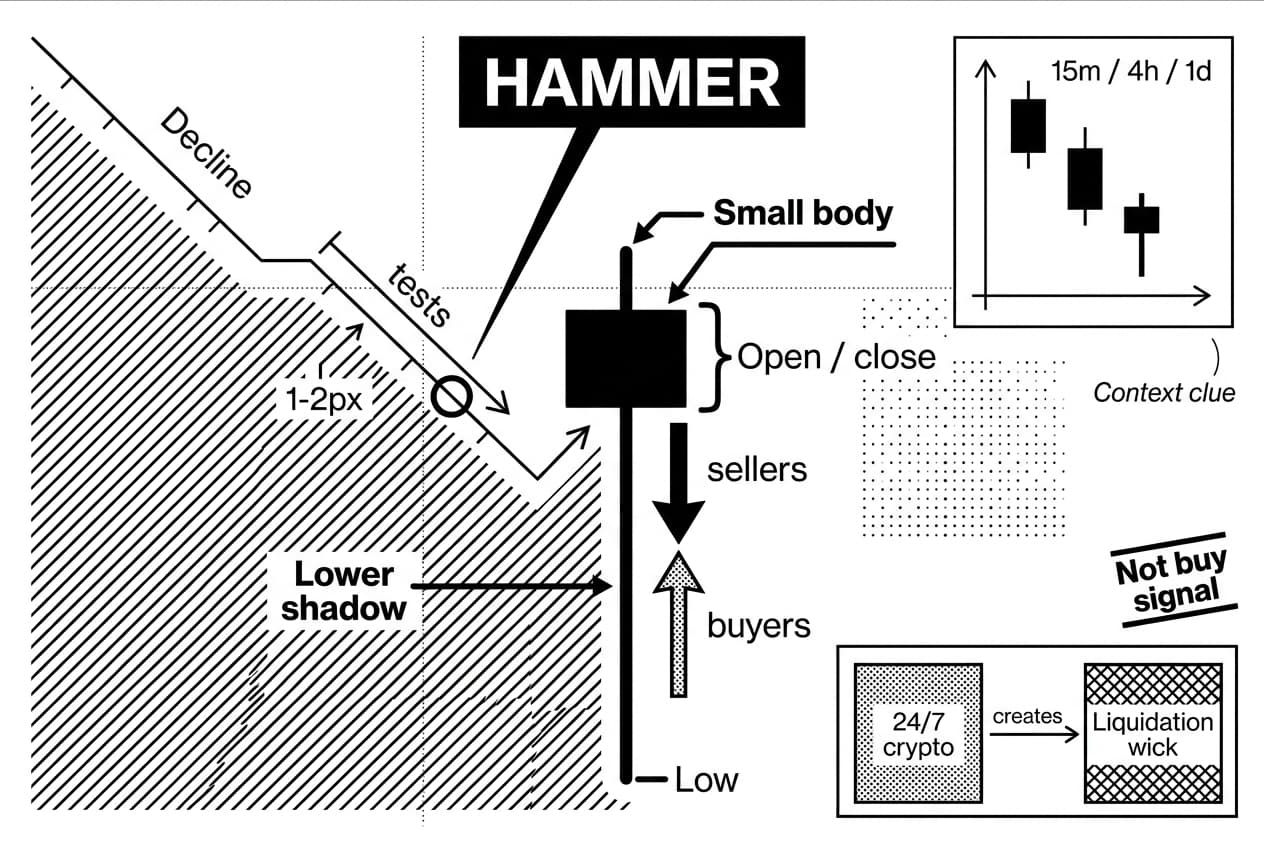
Why it matters: crypto trades continuously, not just during exchange hours. Coinbase describes crypto markets as operating 24 hours a day, 7 days a week (Coinbase Learn, accessed Aug. 14, 2026). That means sudden liquidation wicks can appear while many traders are asleep. A hammer helps you slow down, ask what changed, and avoid treating every bounce as a bottom.
Plain-English definition
Every candle on a price chart represents one time period, such as 15 minutes, 4 hours, or 1 day. The candle body is the rectangle between the open and close price. The wick, also called a shadow, shows the highest and lowest prices reached during that period.
A hammer candle appears after a decline. It has a short body near the top and a long lower wick underneath. The shape says sellers controlled the early part of the candle, but buyers were strong enough to pull price back near the open before the candle closed.
The common mistake is calling the hammer candlestick pattern a buy signal by itself. In crypto, that is too loose. Low-liquidity altcoins and forced liquidations can create long lower wicks that look bullish for one candle, then fail quickly. Treat the hammer as a market-context clue, not an entry button.
Brief background
Candlestick charting grew out of Japanese rice trading records before spreading into modern stocks, commodities, foreign exchange, and digital assets. Crypto traders adopted candlesticks because they compress open, high, low, and close data into one visual unit. That compression is useful, but it can also make traders overread a single candle.
As of Aug. 14, 2026, this guide uses a crypto-first reading: a hammer is strongest when it appears after a real downtrend, near a tested support area, with volume or follow-through confirming that buyers returned.
Why hammer candlesticks matter in crypto
Crypto markets are fast, global, and fragmented across exchanges. A weekend sell-off can trigger stop-loss orders, forced liquidations, and thin order book moves within minutes. Those conditions are exactly where hammer candlesticks often appear.
The pattern matters because it records a failed push lower. Sellers tried to keep price down. Buyers rejected that lower price. The close near the top of the candle shows that the session ended with buyers in better control than they had at the low.
For market context, Willy Woo, on-chain analyst, publishes Bitcoin cycle and on-chain charts that many crypto traders use to compare price action with broader investor behavior. Macro analyst Lyn Alden, founder of Lyn Alden Investment Strategy, often frames Bitcoin and crypto risk through liquidity, position sizing, and long-cycle thinking rather than isolated chart patterns. Those perspectives fit the core lesson here: a hammer is more useful when it lines up with broader evidence.
One concrete example of why context matters is Bitcoin's 2022 bear-market low. Bitcoin traded near $15,500 in November 2022 after reaching roughly $69,000 in November 2021 (CoinGecko, Nov. 2021 to Nov. 2022 cycle data, accessed Aug. 14, 2026). During that decline, many hammer-like candles appeared before the final low. The shape alone did not end the bear trend.
The buyer-seller story
Every hammer candlestick tells a simple three-part story. First, sellers push price below the open. Second, buyers respond near the low. Third, the candle closes near the top of its range, showing that the market rejected the lower price during that period.
A nearby support level is like a marked exit in a building: it does not save you by itself, but it tells you where people have acted before. A hammer at a known support zone has more meaning than a hammer floating in the middle of a messy range.
One candle alone is not a trading plan. Check the larger trend, the level, volume, and the next candle. For a broader look at how single-candle clues fit with other intraday setups, see candlestick patterns for intraday trading.
- 24/7 trading increases wick risk: liquidation moves can form at any hour.
- The hammer is a clue: it shows buyer response, not a guaranteed reversal.
- Location matters: hammers near tested support are stronger than mid-range hammers.
- Confirmation protects capital: wait for follow-through before planning an entry.
Anatomy of a valid hammer candlestick pattern
Not every long lower wick is a hammer candlestick pattern. The candle needs the right body, wick, color context, and trend location before it deserves attention.
Feature | What It Looks Like | What It Suggests |
|---|---|---|
candle body | Compact rectangle near the top of the candle range | Open and close were close together after a lower-price rejection |
lower shadow | Long wick below the body, usually at least 2 times body length | Sellers drove price lower but could not hold control |
upper shadow | Absent or short compared with the lower wick | The rejection story is cleaner because price closed near the top |
candle color | Green or red body | Green is stronger, but red can still work after confirmation |
trend context | Appears after a clear decline or pullback | Without prior selling, there is no real reversal to measure |
Long lower shadow
The lower shadow is the thin line below the candle body. For a classic hammer, it should be at least about twice the height of the body. That ratio is not magic, but it forces you to separate a genuine rejection candle from an ordinary small pullback candle.
The longer lower wick shows that sellers reached much lower prices during the period. The close near the top shows that buyers erased most of that move before the candle ended. In crypto, this detail is useful only if the move happened in a liquid market where the wick reflects real trading rather than one thin order book print.
Small body near the top
The body shows the distance between the open and close. A small body near the top tells you the final price recovered most of the intraperiod sell-off. If the body is large and closes far below the high, the candle is weaker because buyers did not finish the period in control.
This is different from a doji candle pattern, where the open and close are almost identical and the main message is indecision. A hammer can include indecision, but its main feature is rejection of lower prices after a decline.
Green vs. red hammer candlestick
A green hammer closes above its open. A red hammer closes below its open. Both can signal a possible bullish reversal, but they do not carry the same strength.
A green close tells you buyers recovered the low and finished above the open. A red close tells you buyers recovered the low, but not enough to finish positive. That is why a red hammer needs stronger next-candle confirmation before it becomes tradeable.
Market context: when a hammer actually counts
A hammer candlestick pattern does not carry equal weight in every chart location. The same candle can be useful after a sell-off, meaningless in a sideways range, or misleading after an uptrend.
Downtrend first, reversal second
A hammer is called a bullish reversal pattern because it appears after selling pressure. If there is no decline first, there is no reversal setup. A hammer after five falling 4-hour candles is worth study. A hammer after a strong rally is not the same signal.
Start by zooming out one timeframe. If you trade the 1-hour chart, check the 4-hour chart. If you trade the 4-hour chart, check the daily chart. The goal is to see whether the hammer is fighting the main trend or appearing where sellers may be exhausted.
Support, volume, and liquidity
Support is a price area where buyers previously stepped in. It may be a prior swing low, a consolidation base, or a high-volume area. The hammer is stronger when its lower wick tests that area and then closes back above it.
Volume means the amount traded during a candle. High volume on the hammer or the next candle suggests more participants took part in the rejection. Low volume means the wick may be a thin-market move with little commitment behind it.
Liquidity means how easily an order can be filled without moving price sharply. Bitcoin and ether usually have deeper markets than small altcoins. On smaller tokens, one large sell order can create a perfect-looking hammer that does not reflect broad buyer demand.
Use a simple filter: if the wick low occurs at a prior support area, volume rises, and the next candle closes higher, the hammer deserves attention. If only the shape is present, pass or wait.
- Downtrend required: no prior selling pressure, no valid bullish reversal setup.
- Support adds weight: tested levels matter more than random round numbers.
- Volume confirms participation: thin-volume hammers fail more often.
- Liquidity can distort wicks: small tokens can print false hammer shapes.
- Sideways markets dilute signals: choppy ranges produce many weak candles.
How to confirm a hammer candlestick
Confirmation is the difference between spotting a pattern and planning a trade. A hammer asks a question: did buyers really take control? The next candles provide the answer.
Next-candle confirmation
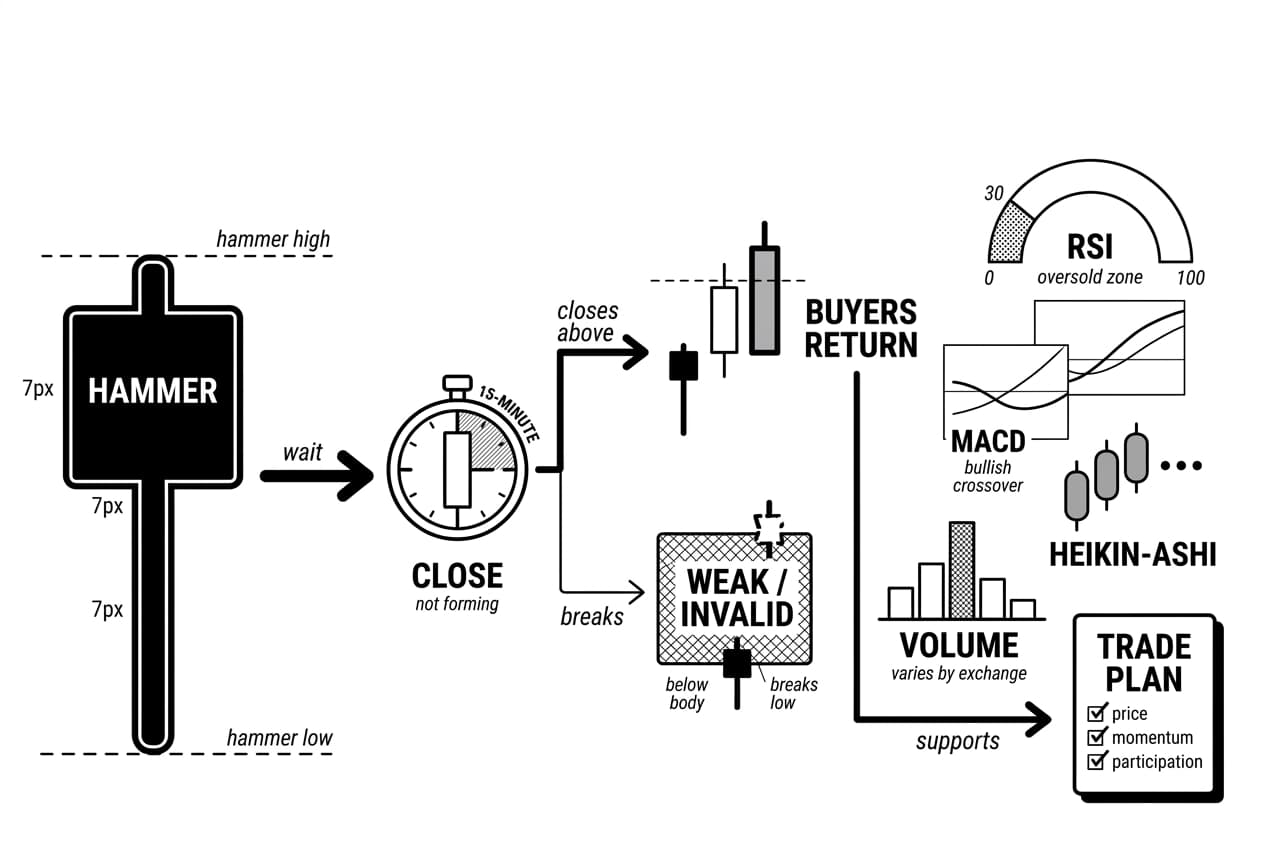
The cleanest confirmation is a following candle that closes above the hammer high. That close shows buyers returned after the first rejection. If the next candle closes below the hammer body or breaks the hammer low, the bullish idea is weak or invalid.
Do not buy while the hammer is still forming. A candle can look perfect halfway through the period and lose its shape before the close. This matters on fast crypto timeframes, where a 15-minute candle can change sharply in its final seconds.
Indicator confirmation
The relative strength index, or RSI, is a momentum indicator that moves on a 0 to 100 scale. Readings below 30 are often labeled oversold (Investopedia RSI guide, accessed Aug. 14, 2026). An oversold RSI near a hammer can support the reversal case, but it should not replace price confirmation.
The moving average convergence divergence indicator, or MACD, compares moving averages to show momentum shifts. A bullish crossover after a hammer can add support. You can also compare the signal with heikin-ashi candles, which smooth price action and can make trend direction easier to read.
Volume confirmation
Higher-than-usual volume during the hammer or on the confirmation candle suggests real buyer participation. Still, crypto volume data varies by exchange. For large trades, compare at least two reputable data sources before trusting a single volume spike.
Our original 4C Hammer Filter uses four checks: context, candle, confirmation, and controls. Context asks whether a decline and support exist. Candle checks the body and wick. Confirmation waits for follow-through. Controls define entry, stop, target, and size before capital is at risk.
How to trade the hammer candlestick
Trading the hammer candlestick pattern means turning a visual clue into a rule-based setup. The goal is not to catch every bottom. The goal is to take only the hammers that offer clear invalidation and acceptable risk.
Step-by-step setup
- Identify the downtrend. Confirm sellers controlled the prior candles.
- Find support. Mark a prior swing low or demand zone.
- Spot the hammer. Check body, lower wick, and close location.
- Wait for confirmation. Look for a close above the hammer high.
- Plan entry. Enter near confirmation or on a controlled pullback.
- Set stop. Place invalidation below the hammer low.
- Choose target. Use resistance or a defined reward-to-risk plan.
Entry, stop loss, and target
A stop loss is an order that exits the trade if price moves against the setup. For a hammer trade, the usual invalidation point is just below the hammer low. If price breaks that low after confirmation, the market has rejected your bullish thesis.
Example: bitcoin falls from $70,000 to $64,000, prints a hammer with a $62,800 low, then the next candle closes at $64,700. A trader might enter near $64,700 and place a stop under $62,800. If the next resistance is $68,500, the planned target is visible before entry.
For more on mapping targets and invalidation across different patterns, see crypto chart patterns and risk rules.
Position sizing and risk
Position sizing means deciding how much of your account can be lost if the trade fails. A common beginner limit is 1% to 2% of account equity per trade, and the investor education site Investor.gov warns that margin and concentrated exposure can increase losses (Investor.gov margin account glossary, accessed Aug. 14, 2026).
If your account is $5,000 and you risk 1%, the maximum planned loss is $50. If the distance from entry to stop is $200 per unit, position size must be adjusted so the stop-out equals $50, not the amount you wish you could trade.
This is where the hammer becomes practical. The wick low gives you a clear invalidation level. Without that level, you are not trading a setup. You are hoping.
Example of a hammer candlestick in action
Examples make the pattern easier to test. The following chart-note transcript is a training example, not a claim about a specific historical trade.
Bullish confirmation example
Chart-note transcript: ETH falls from $3,200 to $2,840 over three sessions. On the fourth session, it opens at $2,850, drops to $2,720, and closes at $2,835. The lower wick is long, the body is small, and the candle appears near support.
The next candle closes at $2,910, above the hammer high. A trader enters near $2,910, places a stop below $2,720, and targets the $3,050 resistance zone. The trade has a defined thesis, a defined failure point, and a defined target.
Failed hammer example
Now change one detail. The next candle closes at $2,700, below the hammer low. That close invalidates the bullish setup. The hammer shape was real, but the market did not confirm it.
This is why the hammer low matters. It is not a decoration on the chart. It is the point where your reversal idea is wrong. Good traders respect that point quickly instead of turning a failed setup into a long-term bag.
Reliability, limitations, and common mistakes
How reliable is the hammer candlestick?
The honest answer is that the hammer candlestick pattern is useful, but conditional. It is more reliable after a clean decline, near support, with rising volume, and with a next-candle close above the hammer high. It is weak when used alone.
Use the 4C Hammer Filter to journal every setup:
- Context: Was there a real decline and a clear support level?
- Candle: Was the lower wick at least about 2 times the body?
- Confirmation: Did the next candle close above the hammer high?
- Controls: Were entry, stop, target, and size written before entry?
After 20 journaled trades, review your screenshots and notes. Track win rate, average win, average loss, and whether failed trades ignored one of the 4C checks. That small dataset will teach you more about your market and timeframe than memorizing pattern names.
Mistakes to avoid
- Buying before the candle closes. A live wick can shrink before the period ends.
- Ignoring the broader trend. A hammer in a strong downtrend may be only a pause.
- Skipping support analysis. Shape without location has little trading value.
- Placing stops too tight. Crypto noise can trigger stops before confirmation develops.
- Using borrowed funds too early. False hammers can liquidate oversized positions quickly.
- Trading illiquid altcoins. Thin order books can manufacture clean-looking wicks.
Frequently Asked Questions
- What is a hammer candlestick pattern?
- A hammer is a single-candle pattern with a small body near the top and a long lower shadow, at least twice the body's length. It forms when sellers push price sharply lower during the session, but buyers step in and recover most of that ground before the candle closes.
- Is a hammer candle bearish or bullish?
- A hammer is generally read as a potential bullish reversal signal when it appears after a sustained decline. That said, it doesn't guarantee a reversal on its own. You need confirmation from the next candle, a nearby support level, rising volume, or broader market context before acting on it.
- How do you trade a hammer candlestick?
- First, identify a downtrend and spot a hammer forming near a key support level. Wait for the next candle to close above the hammer's high before entering. Place your stop-loss below the hammer's low, and set a profit target at a nearby resistance level or based on a defined risk-reward ratio.
- Are a hanging man and a hammer the same pattern?
- They look nearly identical but carry opposite implications because context changes everything. A hammer forms after a price decline and suggests a potential bullish reversal. A hanging man appears after an uptrend and may signal weakening momentum. The shape is similar, but location on the chart determines the meaning.
- Which candlestick pattern is the most bullish?
- There's no single universal answer. Bullish engulfing, morning star, and hammer patterns can all be powerful signals when they appear at strong support levels with confirming volume. Reliability depends heavily on the timeframe you're trading, the strength of the trend, and what happens on the following candles.
- Is a red hammer still bullish?
- Yes, a red hammer can still carry a bullish implication if it forms after a decline and the following candle confirms upward movement. A green hammer is generally considered slightly stronger since buyers fully erased the session's losses, but candle color matters far less than overall context and price follow-through.
Sources
Author

Crypto analyst and blockchain educator with over 8 years of experience in the digital asset space. Former fintech consultant at a major Wall Street firm turned full-time crypto journalist. Specializes in DeFi, tokenomics, and blockchain technology. His writing breaks down complex cryptocurrency concepts into actionable insights for both beginners and seasoned investors.