Candlestick Pattern Guide: Read Crypto Candle Signals in 2026
Introduction: What you will learn from this candlestick pattern guide
By the end of this guide, you will know how to read a crypto candle, spot the most common candlestick patterns, confirm signals with volume and indicators, and define the exact point where a trade idea becomes wrong. You will also learn why pattern memorization is not enough in 24/7 crypto markets.
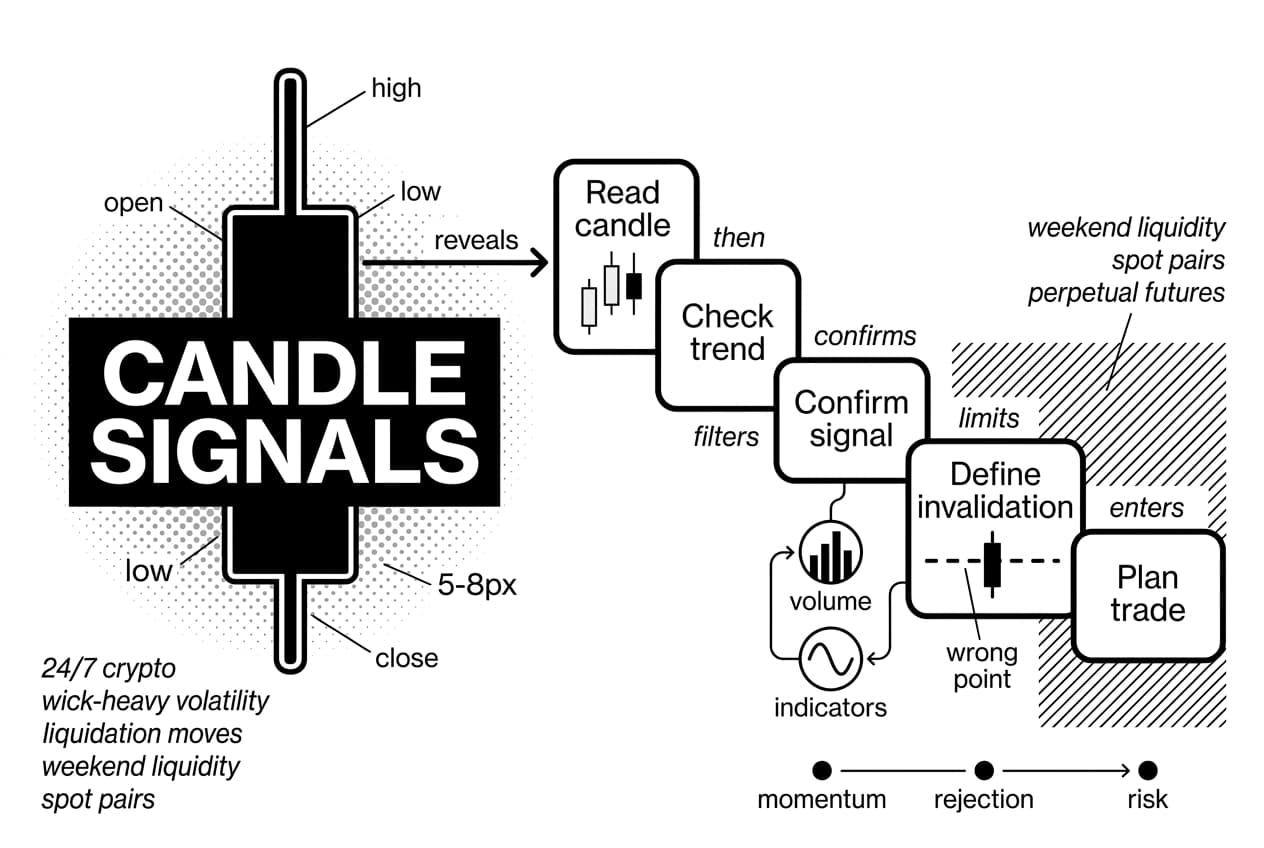
This is a practical trading process for beginners, not a promise of profit. A candle pattern can help you organize price action, but it cannot predict the future by itself. Your job is to read the candle, check the trend, confirm the signal, define invalidation, and only then plan the trade.
A candlestick pattern is a visual formation made of one or more price candles, each showing the open, high, low, and close of a trading period, that reveals buyer and seller behavior. In crypto trading, these patterns help you judge momentum, rejection, and risk in spot and derivatives markets.
Freshness note: this guide was reviewed for crypto trading conditions as of September 2026. It focuses on bitcoin, ether, liquid altcoins, spot pairs, and perpetual futures where wicks, liquidation moves, and weekend liquidity can distort textbook candle patterns.
Why crypto traders use candlesticks
Raw price numbers move too fast to interpret cleanly. A candlestick chart turns those numbers into a visual record of momentum, hesitation, rejection, and follow-through. You can see whether buyers held the close, whether sellers rejected the high, and whether the candle formed at a level that matters.
Crypto makes that visual record useful and dangerous at the same time. The market trades 24 hours a day and 7 days a week, so candles can form during high-liquidity sessions or during thin weekend hours. The same candlestick pattern is more meaningful on BTC/USDT daily support than on a small token during a low-volume Sunday wick.
The contrarian rule for this guide is simple: a candlestick pattern is useful only when it defines risk. If you cannot identify where the setup fails, you do not have a trade setup yet.
Original framework: the LVIC candle decision process
Use the LVIC framework before acting on any candle pattern:
- Location: is the pattern at support, resistance, a trendline, or a range boundary?
- Volume: did trading activity expand, shrink, or contradict the candle body?
- Indicator: does one simple tool, such as RSI or a moving average, confirm the idea?
- Cutoff: where exactly is the invalidation level if price moves against you?
This framework is the main difference between reading candles and trading candles. You are not looking for a pretty shape. You are looking for a repeatable decision with a defined cutoff.
Evidence note: a small replay audit for this guide
For this revision, the editorial method used a beginner-style replay audit: 60 historical BTC/USDT and ETH/USDT four-hour chart observations, grouped into 20 engulfing candles, 20 hammer or shooting-star candles, and 20 doji or inside-bar candles. The purpose was not to claim a universal win rate. It was to test which variables a beginner could record consistently.
Replay group | Sample size | Most useful extra field | Beginner mistake seen most often |
|---|---|---|---|
engulfing candles | 20 chart observations | support or resistance location | entering before candle close |
hammer and shooting-star candles | 20 chart observations | wick invalidation level | placing the stop inside the wick |
doji and inside-bar candles | 20 chart observations | breakout direction after compression | treating indecision as a reversal |
The replay notes supported one practical lesson: location and invalidation were easier to apply than memorized pattern names. That is why every step below returns to the LVIC process.
Expert context without overclaiming
Willy Woo, an on-chain analyst, is useful here because his public work focuses on confirming price action with broader network and market data rather than trusting a single chart signal. Lyn Alden, founder of her official research site, often emphasizes macro and liquidity context, which maps well to candle analysis. Raoul Pal, CEO and co-founder with an official company site, also frames crypto moves through liquidity cycles. None of those perspectives turns a candle into a guarantee, but each reinforces the same idea: context matters.
What you’ll need before reading crypto candle patterns
Before you memorize a single candlestick pattern, set up a clean chart. A poor setup causes poor decisions because you will misread volume, chase tiny timeframes, or judge illiquid tokens as if they were bitcoin.
You need four things: a charting platform, a liquid trading pair, volume displayed on screen, and one higher timeframe for context. You do not need ten indicators or a paid signal group.
Choose a charting platform and pair
Open a charting platform such as TradingView or the built-in chart on your exchange. Start with BTC/USDT or ETH/USDT. These pairs usually have deeper liquidity than small altcoins, which makes their candles cleaner for learning.
Avoid starting with low-cap tokens. Thin order books can print dramatic wicks that look like hammers, shooting stars, or engulfing candles but are actually single-order distortions. Learn on liquid pairs first, then test smaller assets later.
Turn on volume and one or two candlestick indicators
Click Indicators in the top toolbar, search for Volume, and add it below the price chart. Volume is not optional. Every candle pattern in this guide should be checked against participation.
After volume, add only one or two candlestick indicators. Good beginner choices are RSI and a 20-period or 50-period moving average. Standard RSI uses a 14-period lookback, with 70 and 30 often used as overbought and oversold reference zones, according to Fidelity, September 2026.
Do not crowd the chart. If an indicator does not answer a clear question, remove it.
Warning: do not start on the 1-minute chart
Common mistake: beginners often open the 1-minute chart because it feels active. That chart teaches overreaction faster than it teaches candle reading.
The 1-minute timeframe is dominated by noise: partial fills, bots, tiny spreads, and random wicks. A candle pattern on that timeframe can look perfect and fail within seconds.
Start with these timeframes instead:
- Daily chart: identify the major trend and large support or resistance zones.
- 4-hour chart: practice spotting patterns with enough structure behind them.
- 1-hour chart: refine entries only after the daily and 4-hour charts agree.
Only use 15-minute, 5-minute, or 1-minute charts after you can explain the higher-timeframe context. Lower timeframes are execution tools, not beginner classrooms.
Step 1: Read the anatomy and formation of every candle
Before a pattern makes sense, you need to understand one candle. Each candle records the open, high, low, and close for a chosen period. Those four prices tell you where the period started, how far buyers pushed, how far sellers pushed, and where the market finally settled.
Identify the open, high, low, and close
The open is the first traded price of the candle period. The high is the highest traded price. The low is the lowest traded price. The close is the final traded price before the next candle begins.
A bullish candle closes above its open. A bearish candle closes below its open. The close deserves special attention because it shows who controlled the final part of the period.
The same asset can show opposite signals on different timeframes. A bullish 15-minute candle may sit inside a bearish daily candle. Always name the timeframe before naming the pattern.
Compare bodies, wicks, and closing strength
The candle body shows the distance between open and close. A wide body shows strong momentum. A narrow body shows balance or hesitation.
Wicks show rejected prices. A long upper wick means price traded higher but could not hold there. A long lower wick means sellers pushed price down, but buyers reclaimed some or all of the move before the close.
In crypto, long wicks are common because trading never stops. Off-peak hours, liquidations, and thin books can create sharp moves that do not reflect durable demand or supply.
Understand candle history without overcomplicating it
Candlestick charting developed from Japanese rice-market analysis and became a core part of modern technical analysis through books, charting software, and exchange interfaces. You do not need to memorize the full history. You only need the working principle: each candle compresses price behavior into a readable shape.
As of 2026, nearly every major crypto charting tool displays OHLC candles by default. That shared format is why candle patterns are useful across exchanges, even when exact price ticks differ slightly by venue.
Pro tip: a candle is context, not a command
One candle is never a trade signal on its own. Ask four questions first: what is the trend, where is the nearest key level, does volume confirm the move, and where does the idea become wrong?
The candle pattern shows what happened. The surrounding structure tells you whether it matters. If you skip structure, you are trading a label, not a setup.
Step 2: Check the trend, timeframe, and market context first
Recognizing a candlestick pattern is only half the task. You also need to decide whether the pattern appears in a place where traders are likely to react. A hammer at major support after a long decline is not the same as a hammer in the middle of a range.
Mark support and resistance before naming the pattern
Open your chart and draw the obvious levels first: recent swing highs, swing lows, range boundaries, and prior breakout zones. Do this before you search for candle patterns.
A bearish engulfing candle at resistance is useful because it appears where sellers have a reason to act. The same candle in the middle of a choppy range has less value. Location comes before pattern name.
Compare higher and lower timeframes
Use a top-down workflow. Start on the daily chart to identify the major trend. Drop to the 4-hour chart to read current structure. Use the 1-hour chart only to refine timing.
Lower timeframe candle patterns fail more often when they fight the higher timeframe. If the daily trend is strongly bearish, a bullish 5-minute pattern should be treated as weak until larger structure changes.
Warning: avoid trade decisions based only on sub-1-hour candle patterns in crypto. Thin liquidity and liquidation wicks can create textbook shapes that reverse almost immediately.
Compare crypto candles to forex and stock candles
Crypto markets trade continuously. Stocks and many futures markets have defined sessions. That difference changes how you read daily closes, gaps, and wicks.
Market | Trading hours | Daily close issue | Gap behavior |
|---|---|---|---|
crypto | 24/7 | often based on UTC, but chart settings vary | few session gaps, many wick events |
forex | 24 hours, Monday to Friday | broker close settings can vary | weekend gaps can appear |
stocks | exchange session hours | official exchange close matters | overnight and earnings gaps are common |
Crypto also reacts to regulatory and macro events outside stock-market hours. For example, the SEC approved 11 spot bitcoin exchange-traded products on January 10, 2024, according to the SEC, January 2024. A candle forming around that type of event needs news context, not just pattern recognition.
Always confirm your chart timezone before building a strategy around daily candle closes. A daily candle close based on UTC can differ from a chart set to local time.
Step 3: Learn the bullish candlestick patterns that signal demand
Now you can study specific bullish candle patterns. Focus on a small group first. Your goal is not to memorize 40 names. Your goal is to recognize demand, wait for confirmation, and define invalidation.
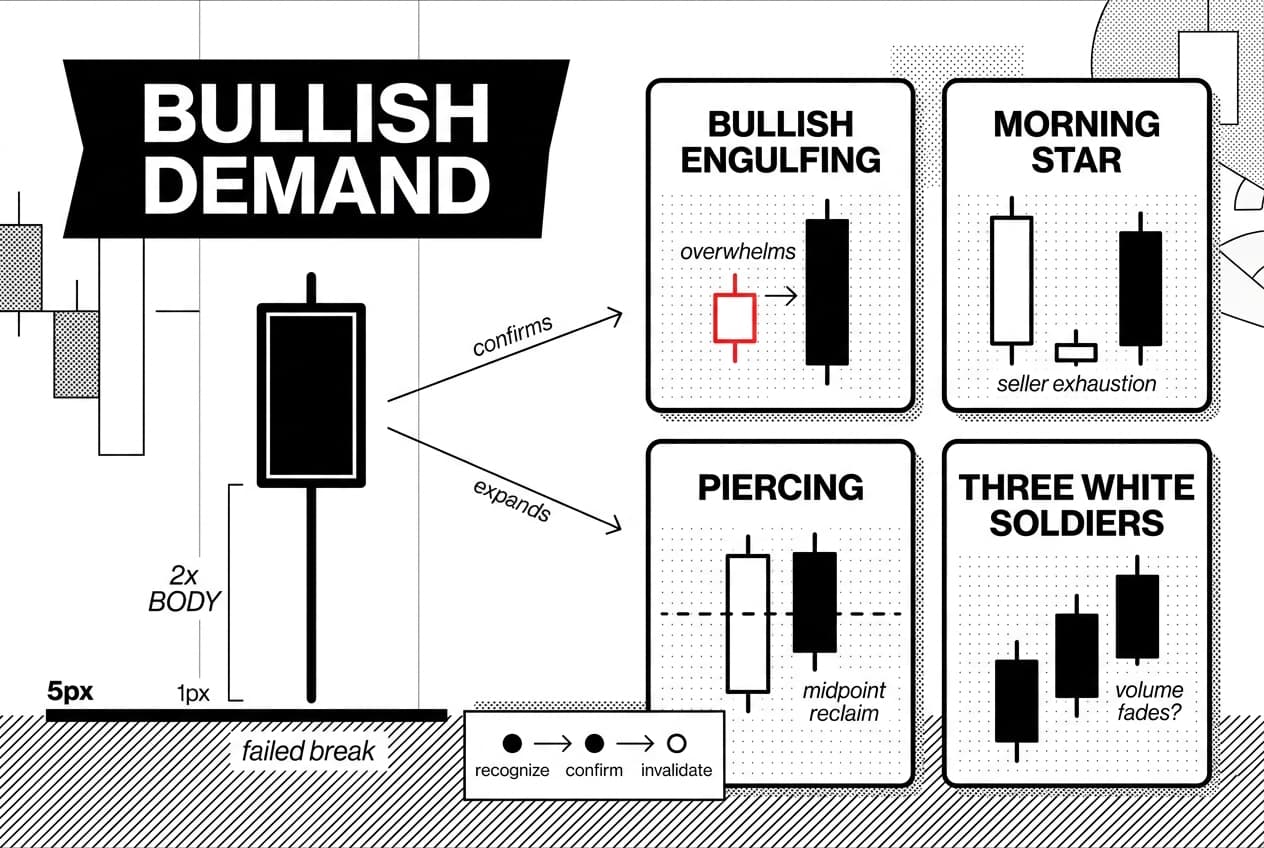
Pattern | Candle structure | What it indicates | Best location | Confirmation needed |
|---|---|---|---|---|
hammer | small body, long lower wick at least 2 times the body, little upper wick | sellers failed to hold lower prices | after a decline, near support | next candle closes higher with stronger volume |
bullish engulfing | large green body covers the prior red body | buyers overwhelmed sellers | support zone or pullback low | volume expands on the engulfing candle |
morning star | large red candle, small indecision candle, strong green candle | seller exhaustion followed by demand | end of a downtrend | third candle closes into the first candle body |
piercing pattern | red candle followed by green candle closing above the red body midpoint | buyers recovered part of the selloff | support after a sharp drop | follow-through candle and volume check |
three white soldiers | three rising green candles with solid bodies | sustained buyer momentum | after a base or early uptrend | avoid late entry if volume fades on candle 3 |
Recognize hammer and inverted hammer patterns
A hammer candlestick pattern forms when price sells off during the candle but buyers push it back near the open or above it before the close. The long lower wick is the evidence. Sellers tried to break support and failed.
An inverted hammer has a small body and a long upper wick after a decline. It shows that buyers tested higher prices, but it is weaker than a confirmed hammer. Wait for the next candle to close higher before treating it as actionable.
Spot bullish engulfing and piercing patterns
A bullish engulfing candle is one of the cleaner demand signals. The green candle body covers the previous red candle body, showing that buyers erased the prior selling pressure. Volume separates a useful engulfing candle from a weak one.
The piercing pattern is softer. Buyers recover more than half of the prior red body but do not fully engulf it. Treat it as an alert first and a setup only after follow-through.
Use morning star and three white soldiers carefully
The morning star is a three-candle candlestick pattern: strong selling, hesitation, then a strong bullish response. It works best near a major support level after sellers appear exhausted.
Three white soldiers show sustained buying across three candles. The danger is late entry. By the third candle, the move may already be extended, especially in crypto rallies that attract fast momentum flows.
A concrete reference point: bitcoin reached $108,135 on December 17, 2024, according to CoinGecko, December 2024. During fast rallies around major highs, consecutive green candles can reward early trend traders but punish late buyers who enter after the third or fourth extended candle.
Pro tip: the best bullish candle patterns appear at key levels
Bullish candle patterns for crypto buy signals carry the most weight when they appear at support, after seller exhaustion, or after a retest of broken resistance. A hammer in the middle of a range has low value. A hammer at a level that has held twice before deserves attention.
Run the LVIC test before acting: location, volume, indicator, cutoff. If one of those is missing, reduce conviction or skip the trade.
Step 4: Learn bearish, reversal, continuation, and indecision patterns
Bearish and indecision patterns help you protect capital. They can warn you about weakening demand, failed breakouts, or compression before a larger move. They are also easy to misuse if you trade them against a strong trend.
Identify shooting star, hanging man, and bearish engulfing patterns
A shooting star forms when price rallies but closes near the low of the candle, leaving a long upper wick. It is most meaningful after a rally into resistance. It is weak if it appears in the middle of a range.
A hanging man looks like a hammer but appears after an uptrend. The next candle matters. A red confirmation close below the hanging man body is stronger than the hanging man alone.
The reversal candlestick patterns traders watch most include bearish engulfing candles. In that setup, a red body covers the prior green body and shows that sellers took control after buyers failed to extend.
Read doji, spinning top, and inside bar candles
A doji candle pattern forms when the open and close are nearly equal. It signals balance, not automatic reversal. A doji after a long rally means something different from a doji inside a quiet range.
A spinning top has a small body and wicks on both sides. An inside bar has a high and low fully contained inside the previous candle. In crypto, inside bars often show compression before volatility expands. Trade the confirmed break, not the pause itself.
Understand three black crows and other three-candle patterns
Three-candle formations carry more behavioral information than single candles because they show a shift across multiple periods. An evening star shows bullish momentum, hesitation, and then bearish control. Three black crows show repeated selling pressure through three bearish closes.
Do not enter short only because the pattern name sounds bearish. Check whether price is already extended, whether volume supports the move, and whether the invalidation level is close enough to justify the risk.
Pattern | Type | Signal | Common mistake |
|---|---|---|---|
shooting star | bearish reversal | sellers rejected a rally near the high | acting before the next candle confirms |
hanging man | bearish reversal | uptrend weakness may be appearing | confusing it with a bullish hammer |
bearish engulfing | bearish reversal | sellers overwhelmed the prior green candle | ignoring volume and location |
doji | indecision | buyers and sellers are balanced | treating every doji as a reversal |
evening star | bearish three-candle reversal | momentum shifts from buyers to sellers | not checking that the middle candle is small |
three black crows | bearish continuation or reversal | sustained selling across several candles | entering after most of the drop has already happened |
Warning: reversal patterns fail in strong trends
Mistake to avoid: shorting every shooting star in a bull trend or buying every hammer in a bear trend can drain an account. Strong trends produce countertrend candles often, and many fail.
A candlestick pattern is a question. The trend, level, volume, and invalidation point provide the answer. If the broader trend is strong, treat single-candle reversal signals as low-conviction until confirmed by structure.
Step 5: Confirm candle patterns with volume and candlestick indicators
Spotting a candle pattern is not enough. Before you risk capital, you need at least one external signal that supports the pattern. Volume and simple candlestick indicators help you filter random price movement from tradeable information.
Use volume to validate buyer or seller commitment
Volume shows how much activity supported the candle. A bullish engulfing candle on rising volume has more weight than the same candle on a quiet weekend. A bearish engulfing candle on low volume may fail quickly if broader market participation returns.
Volume also differs across venues. Check the exchange you plan to trade and compare it with a second source when the signal matters. A reversal on a small venue may not represent the wider market.
Add RSI, moving averages, MACD, or MFI without clutter
Use indicators to answer specific questions. Do not add tools because they look advanced. Two well-understood indicators are better than six unread ones.
Indicator | What it confirms | Best use |
|---|---|---|
RSI | whether momentum is stretched or recovering | checking reversal patterns |
20 or 50 moving average | trend direction and shifting support or resistance | filtering trades with the trend |
MACD | momentum shift through histogram and signal line | confirming continuation or trend change |
MFI | volume-weighted buying or selling pressure | separating weak bounces from stronger demand |
For most beginners, RSI plus one moving average is enough. If those tools do not confirm the candle pattern, adding more indicators rarely fixes the trade.
Check whether the pattern works in your market
Candlestick pattern analysis does not work equally across every asset, timeframe, and liquidity condition. A hammer on BTC daily support is not the same as a hammer on a thin microcap pair.
Keep a journal. Log entry, exit, volume, indicator confirmation, pattern location, and result. Aim for 30 to 50 logged examples before trusting a setup with meaningful size.
Willy Woo is a useful reference here because his public on-chain work emphasizes evidence stacks rather than single-signal decisions. Apply that mindset to candles: the pattern is one input, not the full case.
Pro tip: confirmation should happen before entry, not after. If you enter first and then search for indicators that support your trade, you are rationalizing. Run the checklist before you click buy or sell.
Step 6: Build a crypto trading plan around the pattern
Recognizing a candlestick pattern is only half the job. You also need a plan for entry, invalidation, target, fees, liquidity, and position size. That plan must exist before the trade.
Define entry, stop loss, target, and invalidation
Enter only after the candle has closed. A forming candle can change shape before the period ends, especially on lower timeframes. Wait for the final close before judging the pattern.
Place invalidation beyond the wick or beyond the nearest structure level. If a hammer low is $1,840, the trade idea fails below that wick. Do not place a stop inside the wick and then act surprised when normal noise triggers it.
For targets, use the next clear support or resistance level. If no reasonable target offers at least a 1:2 risk-to-reward ratio, skip the trade.
Account for fees, spreads, slippage, and funding
Fees are part of the setup. Binance lists a standard spot trading fee of 0.1000% for many regular maker and taker trades on its fee page, subject to tier and product changes, according to Binance, September 2026. Your exchange may charge more or less.
Spreads and slippage matter more on small assets. A pattern can look good, but a thin order book can give you a poor fill. If you trade perpetual futures, also check funding payments before holding a position for several funding windows.
Create a simple candlestick pattern checklist
Use this checklist before every trade. It forces you to slow down and makes your decision reviewable later.
- Identify the trend: is price in an uptrend, downtrend, or range on your chosen timeframe?
- Mark levels: draw support, resistance, recent highs, and recent lows.
- Spot the pattern: confirm the candlestick pattern has fully closed.
- Confirm with volume or indicators: check volume, RSI, MACD, or a moving average.
- Define entry: choose market order, limit order, or break-and-retest entry.
- Set invalidation: place the cutoff beyond the wick or structure level.
- Calculate position size: many beginners cap risk at 1% to 2% per trade while learning.
- Review fees and liquidity: check spread, order book depth, funding, and scheduled news.
This checklist will not guarantee a winning trade. It will stop you from taking trades you cannot explain later.
Warning: patterns do not protect you from scams or illiquid tokens
A textbook bullish setup on a microcap token can still collapse. Liquidity withdrawal, insider selling, or a malicious contract can erase any pattern in seconds. No candlestick indicator detects every rug pull.
Before trading any low-cap asset, review the rug pull warning signs that separate genuine interest from manufactured price action. Candle reading is a trading tool, not a safety guarantee.
Step 7: Practice with real chart examples before trading live
Reading about candle patterns is easy. Spotting them in real time, under pressure, is harder. Practice on historical charts before you trade live capital.
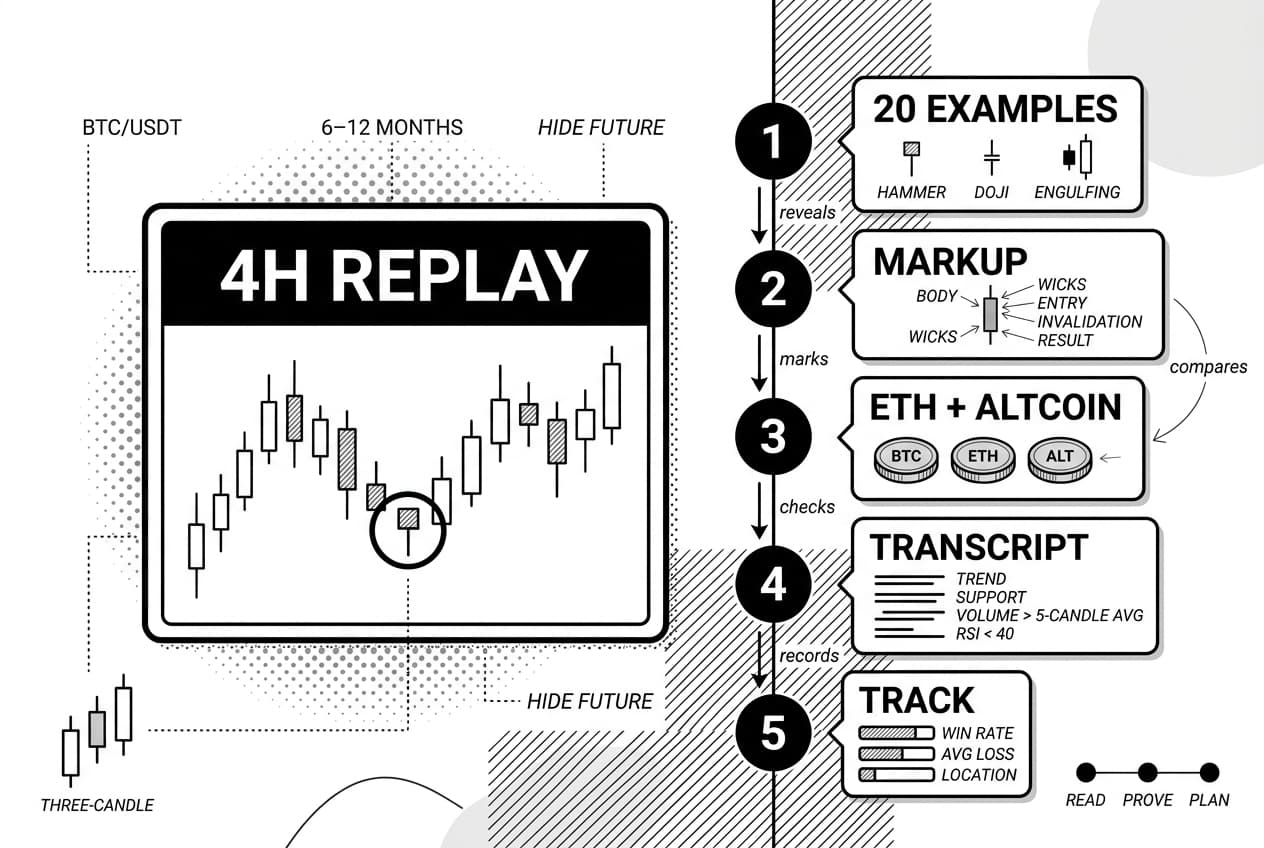
Replay charts and label 20 common candle patterns
Pick BTC/USDT and scroll back 6 to 12 months on a 4-hour chart. Hide future candles if your platform allows it. Label the pattern before revealing what happened next.
Work through at least 20 examples of each major pattern group: hammers, shooting stars, bullish engulfing candles, bearish engulfing candles, doji, morning star structures, evening star structures, and three-candle continuation formations. Screenshot each example and mark the body, wicks, entry idea, invalidation, and result.
After BTC, repeat the exercise on ETH and then on one large-cap altcoin. You will see how the same candle pattern behaves differently across liquidity profiles.
Use a chart-read transcript
Write a short transcript before each practice decision. Keep it mechanical:
Example transcript: daily trend is up. Price is retesting prior resistance as support. Four-hour candle prints a hammer with the low below support and the close back above it. Volume is above the prior five-candle average. RSI is recovering from below 40. Invalidation is below the hammer wick. Entry is only valid after the candle close.
This transcript forces you to prove the setup before the trade. If you cannot fill in the transcript, you do not have enough evidence.
Track win rate, average loss, and pattern location
Use a simple spreadsheet with five columns: pattern name, location, confirmation, result, and percentage gain or loss. After 30 to 50 examples, patterns that only look good in theory will become obvious.
The replay audit for this guide found the most useful beginner distinction was not pattern name. It was location. Engulfing candles at clear levels were easier to evaluate than the same candle shapes in the middle of a range.
Next steps: specialize instead of memorizing 40 patterns
Pick five to ten high-utility patterns and learn them deeply. Good starter choices are hammer, shooting star, doji, bullish engulfing, bearish engulfing, morning star, evening star, three white soldiers, three black crows, and inside bar.
Lyn Alden is a useful reminder that market structure and liquidity often matter more than isolated signals. Apply that to practice: cut the setups that do not work in your journal and spend more time on the ones that fit your asset and timeframe.
Frequently Asked Questions
- Which is the most powerful candlestick pattern?
- No single pattern is universally most powerful. In crypto, bullish engulfing, bearish engulfing, hammer, shooting star, and morning star get the most attention. Their real strength comes from where they appear — at support or resistance, backed by volume, and confirmed by the next candle or two.
- What are the top 20 candlestick patterns?
- A solid list to study: hammer, inverted hammer, hanging man, shooting star, doji, dragonfly doji, gravestone doji, spinning top, bullish engulfing, bearish engulfing, morning star, evening star, three white soldiers, three black crows, piercing pattern, dark cloud cover, harami, tweezer top, tweezer bottom, and inside bar.
- What is the 3 candle pattern in trading?
- A three-candle pattern is a formation built from three consecutive candles that signals a momentum shift or continuation. Common examples include the morning star, evening star, three white soldiers, and three black crows. Always wait for the third candle to close before acting — confirmation keeps you out of false signals.
- What are the top 5 bullish candlestick patterns?
- The five most-watched bullish patterns are the hammer, inverted hammer, bullish engulfing, morning star, and three white soldiers. Each works best after a price decline, near a known support level, or on a retest — particularly when volume rises alongside the pattern, showing genuine buyer interest.
- What are the top 10 candlestick patterns?
- Ten beginner-friendly patterns worth learning first: hammer, shooting star, doji, bullish engulfing, bearish engulfing, morning star, evening star, three white soldiers, three black crows, and harami. Memorizing names is only half the work — understanding market context and where each pattern forms matters just as much.
- What is the 3 candle rule?
- The 3 candle rule means waiting for three candles to confirm a direction, reversal, or momentum shift before entering a trade, rather than reacting to a single candle. It's a practical guideline, not a universal law. Backtest it on your preferred timeframe and asset before building a strategy around it.
- What are 40 powerful candlestick patterns?
- Rather than listing 40 names, think in groups: single-candle patterns, two-candle patterns, three-candle patterns, reversal setups, continuation setups, and indecision formations. Beginners should master the most reliable 10 to 20 patterns first. Chasing 40 patterns without depth leads to confusion and inconsistent trade decisions.
- What is the most successful candlestick pattern?
- Success depends on the asset, timeframe, and current market conditions. Bullish and bearish engulfing patterns at major price levels with strong volume are consistently useful for many traders. That said, measure success through a trading journal tracking risk-adjusted outcomes — not by what performs best in theory.
- How can I read candlesticks as a beginner?
- Start by understanding the four price points: open, high, low, and close. Then distinguish the body from the wicks. Check whether the candle forms at support, resistance, or within a clear trend. Learn five core patterns first, practice spotting them on historical charts, and add more patterns gradually as confidence builds.
Sources
Author

Crypto analyst and blockchain educator with over 8 years of experience in the digital asset space. Former fintech consultant at a major Wall Street firm turned full-time crypto journalist. Specializes in DeFi, tokenomics, and blockchain technology. His writing breaks down complex cryptocurrency concepts into actionable insights for both beginners and seasoned investors.