Bearish Hammer Candlestick: Meaning, Signals & Trading Guide
bearish hammer candlestick: meaning, signals and trading guide
What is a bearish hammer candlestick?
A bearish hammer candlestick is a small-bodied candle with a long lower wick that warns of possible downside pressure when it forms near resistance, after an extended rally, or at a failed breakout level in crypto markets that trade every hour of the week.
The nuance matters. The same candle shape can look bullish after a selloff, neutral inside a range, or bearish near resistance. That is why the label can confuse new traders: the candle’s meaning depends more on trend location, confirmation, volume, and invalidation than on red or green color alone.
Why it matters: a long lower wick can tempt traders to buy too early because it shows a sharp recovery from intraperiod lows. In crypto, that recovery can also be a liquidity sweep, a failed breakout, or buyer exhaustion. Reading the context first helps you avoid treating one candle as a complete trade plan.
Brief background: where hammer candles come from
Candlestick charts came from Japanese rice markets and later became standard in global technical analysis. A candlestick records four prices for one time period: the open, the high, the low, and the close. The body shows the gap between open and close. The thin lines above or below the body are shadows, also called wicks, and they show the session’s price extremes.
Crypto traders now apply these ideas to bitcoin, ether, and smaller tokens across one-minute, four-hour, daily, and weekly charts. The catch is that crypto has no official market close. A daily candle on one exchange can differ from another exchange if their charting tools use different time zones, so confirmation matters more than the pattern name.
Why it matters for crypto traders in 2026
As of August 2026, the bearish hammer label is most useful as a context warning, not as a standalone sell button. Crypto markets are open 24 hours a day and 7 days a week, so long wicks can form during thin weekend liquidity, exchange-specific order-book gaps, or news-driven liquidation waves.
The market structure has also changed. The U.S. SEC approved the listing and trading of 11 spot bitcoin exchange-traded products (SEC, Jan. 10, 2024). Bitcoin’s fourth halving cut the block subsidy from 6.25 BTC to 3.125 BTC (Coinbase, Apr. 2024). CoinGecko reported that total crypto market capitalization ended Q1 2024 at about $2.9 trillion (CoinGecko, Apr. 2024). Those milestones brought more liquidity, more derivatives activity, and more fast reactions around key price levels.
A practical analogy: a candle is closer to an auction receipt than a fortune-telling card. The wick shows how far the auction traveled. The close shows where buyers and sellers agreed when the timer ended. If price rejects resistance and the next candle breaks lower, the receipt tells a different story than a hammer that forms after panic selling into support.
Anatomy of a bearish hammer candlestick pattern
The bearish hammer candlestick pattern starts with shape, but it only becomes useful after location and confirmation are checked. Learn the anatomy first, then decide whether the candle is a trade signal or only market noise.
Body, wick, and shadow explained
A candlestick has three visible parts. The real body is the rectangle between the open and close. The lower shadow is the line below the body and shows how far price dropped before recovering. The upper shadow is the line above the body and shows how far price rose before fading.
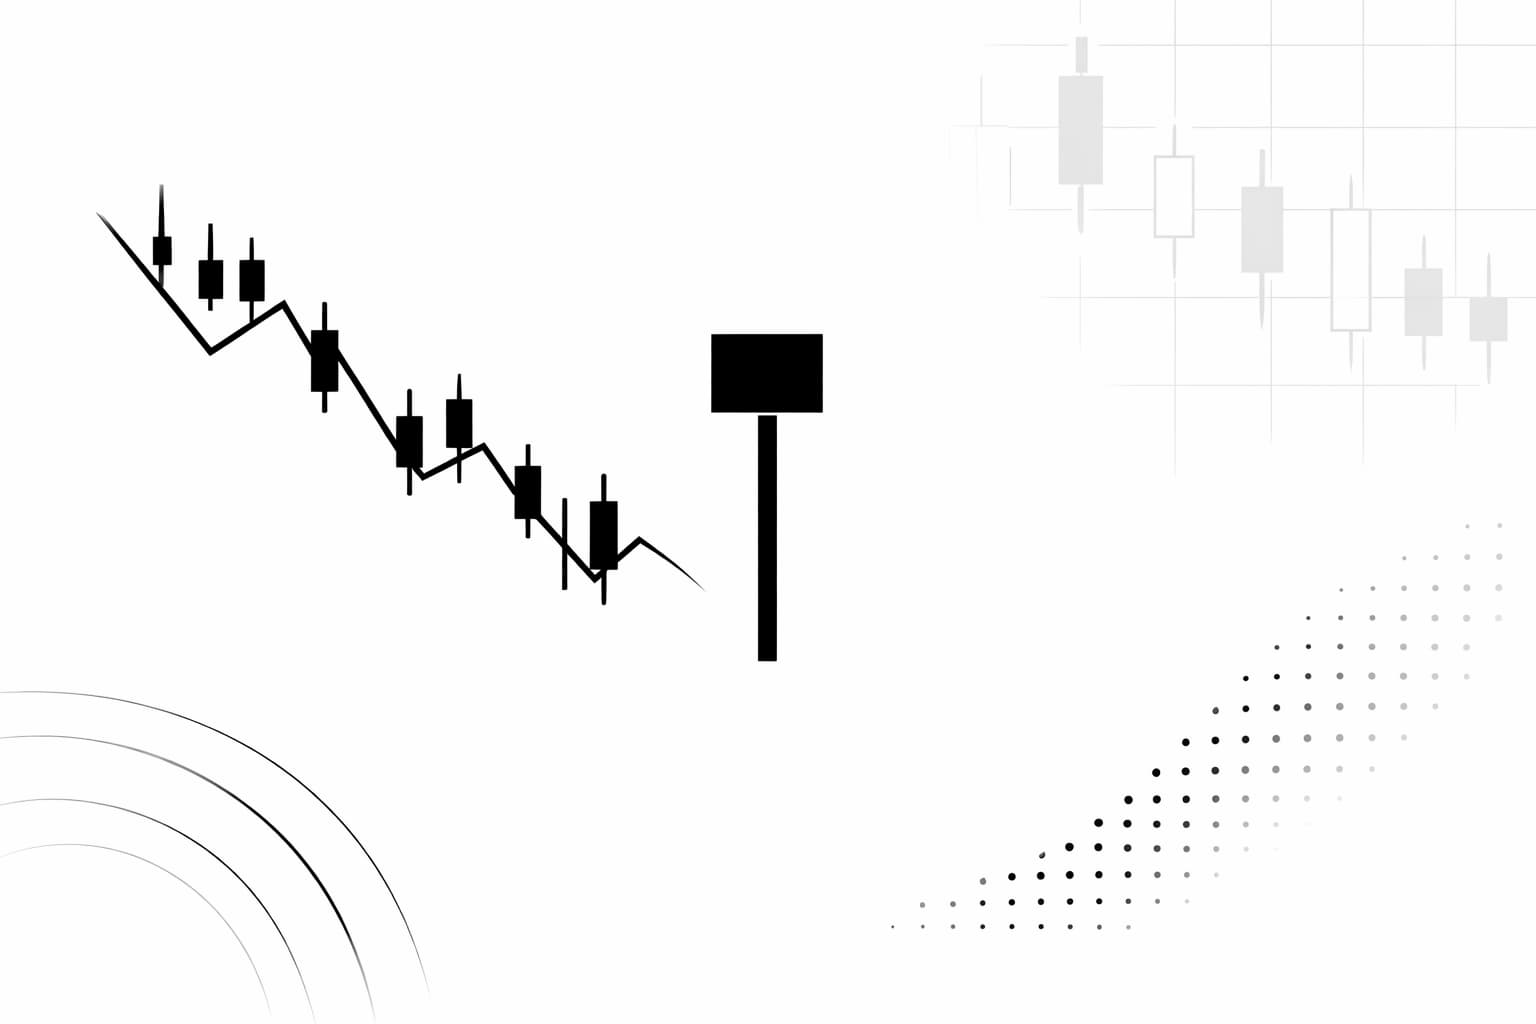
A hammer-shaped candle usually has a small body near the top of the candle, a long lower shadow, and little or no upper shadow. Many charting guides use a simple rule of thumb: the lower shadow should be at least 2 times the height of the real body (Investopedia, 2024).
Example: suppose ether opens at $3,000, drops to $2,850, then closes at $2,990 during a four-hour candle. The real body is only $10, while the lower wick is $150. That shows sellers pushed hard during the session, but buyers recovered most of the move before the close. If this happens after a long rally at resistance, the recovery may still be weak because buyers failed to extend the trend.
Green vs. red bearish hammer candles
A green candle closes above its open. A red candle closes below its open. Color helps, but it does not decide the signal by itself. A red hammer after a deep selloff can still be a bullish reversal attempt. A green hammer near resistance can still warn that buyers are tired.
Use the CLV filter for this article: context, level, and validation. Context asks what the prior trend was. Level asks whether the candle formed at resistance, support, or inside a range. Validation asks what the next candle and volume did. If the pattern fails any part of CLV, treat it as observation, not a trade.
For broader market context, Lyn Alden, founder of Lyn Alden Investment Strategy, publishes research that connects price behavior with liquidity, macro conditions, and market structure. That is the right mindset for candlestick work: one candle is a small data point inside a larger system.
- Real body: the distance between open and close.
- Lower shadow: the distance from the body to the session low.
- Upper shadow: the distance from the body to the session high.
- Color: useful, but secondary to trend location and follow-through.
- Close location: often the most important part of the candle because it shows who controlled the finish.
Bearish hammer vs similar candlestick patterns
Several candlestick patterns look similar because they use the same building blocks: body size, wick length, and trend location. The name is less important than where the candle appears. The doji candle pattern is useful to study alongside these because it shows indecision in a different form.
Hammer, hanging man, shooting star, and inverted hammer
A hammer after a downtrend usually points to a possible bullish reversal. The same small body and long lower wick near the top of an uptrend is often called a hanging man and can warn of downside risk. A shooting star has the wick above the body and often appears near resistance. An inverted hammer also has an upper wick, but it normally appears after a decline and needs a strong bullish follow-through candle.
Pattern | Shape | Usual Location | Typical Bias | Confirmation Needed |
|---|---|---|---|---|
bearish hammer | Small body, long lower wick, little upper wick | After an uptrend, near resistance, or at a failed breakout | Bearish warning or buyer exhaustion | Next candle closes lower, ideally with higher volume |
hammer | Small body, long lower wick, little upper wick | After a downtrend, near support | Possible bullish reversal | Next candle closes above the hammer body or high |
hanging man | Small body, long lower wick, little upper wick | After an uptrend | Bearish reversal warning | Next candle closes below the body or nearby support |
shooting star | Small body, long upper wick, little lower wick | After an uptrend, near resistance | Bearish rejection | Bearish follow-through candle and failed reclaim of the high |
inverted hammer | Small body, long upper wick, little lower wick | After a downtrend | Possible bullish reversal | Strong bullish close on the next candle |
The key lesson is simple: shape creates the watchlist, but location creates the interpretation. A hammer-shaped candle at resistance is not the same signal as a hammer-shaped candle at support.
How to confirm a bearish hammer signal
Confirmation means waiting for extra evidence before risking capital. That evidence can come from market structure, volume, momentum indicators, or a decisive next candle.
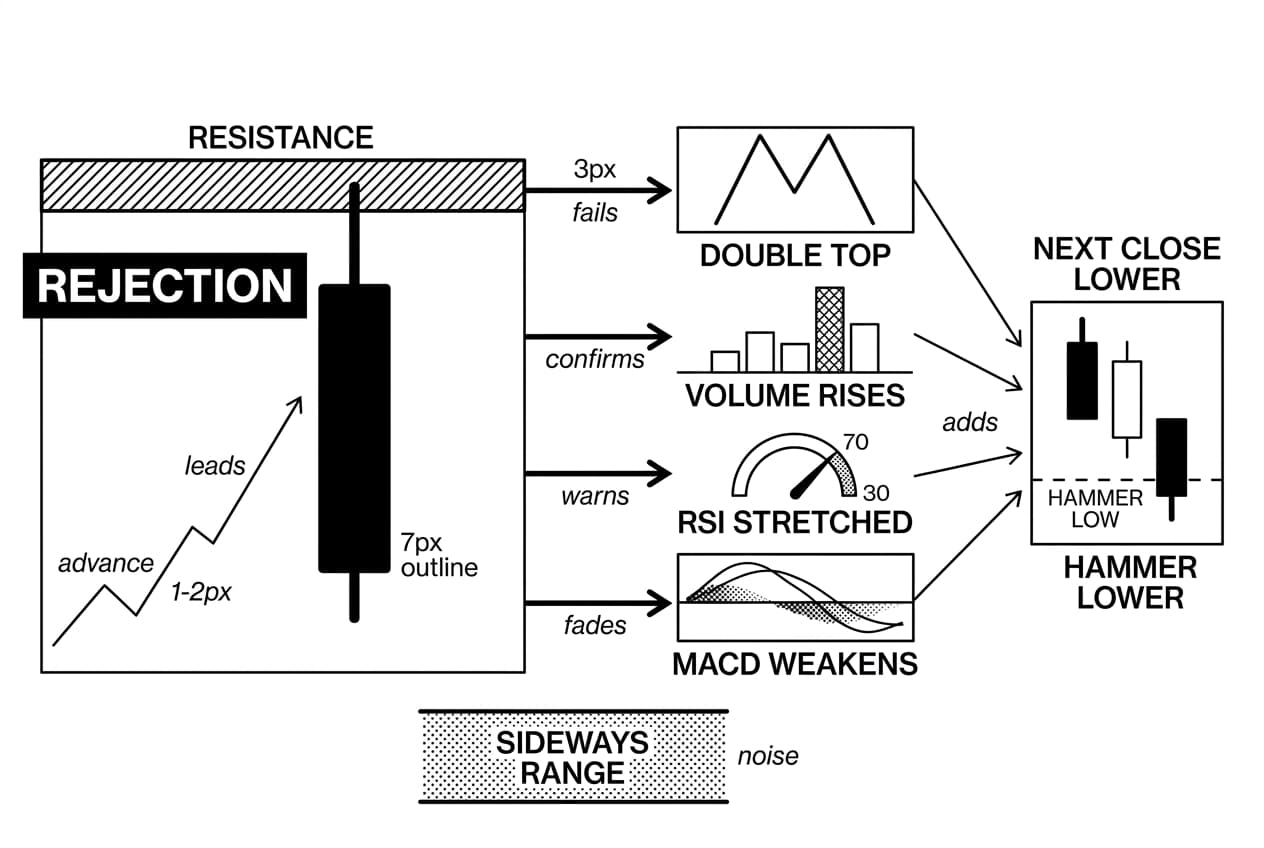
Use market context first
Start with the chart structure. A bearish reading carries more weight when the candle appears after a clear advance, at a prior swing high, under a round-number resistance zone, or near a failed breakout. The signal is stronger when it appears beside a double top chart pattern, where price has already failed to break higher more than once.
If the candle forms in the middle of a sideways range, it is usually noise. If it forms directly below a tested resistance level and the next candle closes lower, the bearish case becomes easier to define. That difference is what separates a chart observation from a trade setup.
Volume, RSI, and MACD confirmation
Volume means the amount of an asset traded during the candle. Higher volume on the rejection candle suggests real participation rather than a thin order book. Relative strength index, or RSI, is a momentum tool that often treats readings above 70 as overbought and below 30 as oversold (Investopedia, 2024). Moving average convergence divergence, or MACD, compares moving averages to show changes in momentum.
A useful bearish confirmation stack looks like this: price rejects resistance, RSI is stretched, MACD momentum weakens, volume rises on the rejection, and the next candle closes below the hammer’s low. You do not need every item, but the more independent evidence you have, the less you are relying on one shape.
For crypto-specific context, Willy Woo, an independent on-chain analyst, publishes on-chain charts that help traders compare price action with network activity and capital flows. That perspective is useful because a wick on a price chart can look meaningful even when deeper liquidity data is weak.
Pairing standard candlesticks with heikin ashi candles can also filter noise. These candles smooth price action, which may help beginners see whether a rejection is part of a broader trend change or just a one-candle spike.
How to trade the bearish hammer candlestick
Trading the pattern means converting an observation into a plan with an entry, stop, target, and invalidation point. If any part is missing, the setup is not ready.
A simple step-by-step setup
- Identify the prior trend. Look for a clear advance before the candle. No uptrend means no bearish reversal setup.
- Mark resistance. Draw the level where buyers previously stalled, such as a prior swing high, round number, or moving average ceiling.
- Wait for confirmation. Do not enter on the hammer candle alone. Wait for the next candle to close lower, preferably below the hammer low or nearby support.
- Plan the entry. Enter short, or exit a long position, only after the confirmation candle closes.
- Set the stop loss. Place the stop above the hammer high, with enough room for normal crypto wicks.
- Define the target. Aim for the next support zone and require a reward that is at least twice the planned risk when possible.
This process fits well with the broader candlestick patterns for intraday trading approach, where written rules replace emotional entries.
Example with concrete numbers
Here is an educational trade transcript, not a live recommendation. Suppose bitcoin rallies from $68,000 to $72,000 over three sessions, then prints a small-bodied candle near resistance with a long lower wick. The next candle closes at $70,800, below the hammer low. The setup is now confirmed, but the risk still has to make sense.
Parameter | Example value | Reasoning |
|---|---|---|
Entry | $70,750 | After the bearish confirmation close |
Stop loss | $72,200 | Above the candle high, with wick room |
First target | $69,000 | Next visible support zone |
Risk | $1,450 | Stop minus entry |
Potential reward | $1,750 | Entry minus target |
This example offers only about a 1:1.2 reward-to-risk ratio, so a disciplined trader may skip it or wait for a better entry closer to resistance. The candle pattern is not enough if the math is poor.
This article is educational and is not financial advice. Crypto markets are volatile, and past patterns do not guarantee future results.
Reliability, common mistakes, and risk rules
The bearish hammer candlestick pattern is a probability clue. It is not a prediction. Its reliability improves when the candle appears at a meaningful level, forms after a clear trend, and receives confirmation from the next candle or volume. It weakens when it appears in the middle of a range, during low-liquidity hours, or against the larger market trend.
Common mistakes to avoid
- Trading without trend context. A hammer-shaped candle inside a range has much less value than one at tested resistance.
- Ignoring volume. A thin weekend wick can create a dramatic candle that has little follow-through.
- Using too much borrowed exposure. A normal retest can liquidate an oversized position before the trade has time to work.
- Placing stops too tight. Crypto often retests wick highs before reversing, so give the setup room or skip it.
- Treating one candle as certainty. One candle shows pressure. Follow-through shows whether that pressure mattered.
For a wider view of how these errors affect setups, see our crypto chart patterns and risk rules guide, which covers position sizing and stop placement in more depth.
Keep a trading journal
A trading journal is a record of each trade’s entry, stop, target, exit, timeframe, and reason for taking the setup. Add two useful fields: maximum favorable excursion, which means the furthest price moved in your favor, and maximum adverse excursion, which means the furthest it moved against you.
For a simple 2026 journal test, review 30 bearish hammer candidates on one asset and one timeframe. Tag each one with the CLV filter: context, level, and validation. After the sample is complete, compare the confirmed trades with the ignored candles. That small dataset will teach you more than memorizing pattern names.
Key takeaways
- The label can mislead you. A bearish hammer is not bearish because of its name. It becomes bearish only when trend location and follow-through support that reading.
- Context comes first. The same candle can mean different things at support, resistance, or inside a range.
- Confirmation protects beginners. Wait for the next candle, volume, or a break of nearby support before acting.
- Risk math outranks pattern memory. Skip trades where the stop and target do not offer a sensible reward-to-risk ratio.
- Crypto needs extra care. Around-the-clock trading creates more wick noise, especially during thin liquidity windows.
Frequently Asked Questions
- What does a bearish hammer candlestick mean?
- A bearish hammer may signal buyer weakness or a failed recovery attempt, especially near resistance or after a sustained uptrend. The shape alone tells only part of the story. Traders typically wait for confirmation through the next candle, rising volume, or a clear breakdown below nearby support before acting on it.
- Is a red hammer bullish or bearish?
- A red hammer is not automatically bearish. While a red candle closes below its open, suggesting some seller presence, a hammer forming after a downtrend may still hint at a reversal attempt. What matters more is the trend leading into it, where it appears on the chart, and what price does afterward.
- What is the strongest bearish pattern?
- No single bearish pattern dominates every market condition. Traders frequently pay close attention to bearish engulfing candles, evening stars, shooting stars near resistance, and double tops. Rather than ranking patterns by strength, focus on confirmation signals, volume behavior, and disciplined risk management to improve the odds of any bearish trade.
- Can a bearish hammer be green?
- Yes, a hammer-shaped candle can absolutely be green and still carry bearish implications. If that green candle forms after a prolonged rally, stalls at a known resistance zone, and is followed by a lower close the next session, the bearish case remains valid. Candle color matters far less than location and follow-through.
- Is a bearish hammer a buy or sell signal?
- It is neither an automatic buy nor sell on its own. Conservative traders wait for confirmation before committing. For a bearish trade, many look for a close below the hammer's low. If price instead reclaims resistance convincingly, that can invalidate the bearish read entirely, making patience a critical part of the process.
- Is a hammer candle bullish?
- A classic hammer appearing after a downtrend is generally treated as a bullish reversal signal. However, the same candle shape in a different location — near resistance or during an uptrend — can carry neutral or even bearish implications. Trend context, surrounding price structure, volume, and the following candle all shape the real interpretation.
Sources
Author

Crypto analyst and blockchain educator with over 8 years of experience in the digital asset space. Former fintech consultant at a major Wall Street firm turned full-time crypto journalist. Specializes in DeFi, tokenomics, and blockchain technology. His writing breaks down complex cryptocurrency concepts into actionable insights for both beginners and seasoned investors.