Ichimoku Cloud Crypto Trading Guide: Signals & Setups 2026

ichimoku cloud crypto trading guide: signals and setups for 2026
Introduction: what you will learn about the ichimoku cloud
By the end of this guide, you will know how to add the ichimoku cloud to a crypto chart, read its five parts, and build a rules-based trade plan you can repeat. You will also learn when to ignore a signal, which matters more than finding another entry trigger.
The common pitch says ichimoku is an all-in-one buy and sell tool that works best with the default settings. Our take is more cautious: defaults are useful training wheels, but crypto trades all day, every day, with no fixed session close. You should test settings by asset, time frame, volatility regime and fees before risking capital.
This guide adds a practical framework we use for chart reviews: Location-Direction-Space. Location asks where price and the cross sit relative to the cloud. Direction asks whether tenkan-sen, kijun-sen and the cloud agree. Space asks whether the chikou span has clear room to move without crashing into old price structure.
For broader market context, compare technical signals with macro and on-chain research rather than treating any indicator as proof. Lyn Alden, founder of Lyn Alden Investment Strategy, publishes macro liquidity research that can help you separate a chart setup from the wider risk backdrop. Willy Woo, on-chain analyst at WooCharts, publishes Bitcoin on-chain charts that can help you check whether price action is lining up with accumulation or distribution behavior.
Major takeaways for crypto traders
- Cloud position gives your first trend read: above the cloud is bullish, below the cloud is bearish, and inside the cloud is a warning zone.
- tenkan-sen and kijun-sen show momentum, but a crossover needs cloud confirmation before it becomes tradable.
- chikou span is your final clearance check. If it is stuck in old candles, skip the trade.
- Cloud edges act as support and resistance zones, not exact price lines.
- Risk rules matter more than signal beauty. Ichimoku filters probability; it does not predict the future.
Prerequisites: what you will need before using ichimoku
Before you add ichimoku to a live chart, set up the basics. A clean chart, a liquid pair and a practice account will save you from confusing visual noise with real confirmation.
Chart setup checklist
You need a charting platform that supports ichimoku. TradingView is the easiest starting point for most beginners, and the built-in indicator is available from the Indicators menu. Exchange charts from Binance, Bybit and OKX usually include it too, but their layouts vary.
- Pair: start with BTC/USDT or ETH/USDT because deeper liquidity usually means tighter spreads and cleaner candles.
- Chart type: use candlesticks, not a line chart. Wicks and candle closes matter when you judge cloud breaks.
- Volume panel: keep volume visible under price. A breakout without volume often fails.
- Indicator: add ichimoku cloud from your platform indicator search. Start with default inputs.
- Practice account: paper trade before using real funds, especially if you are new to stops and position sizing.
You should also be comfortable reading crypto candlestick patterns before layering ichimoku on top. The indicator supports candle reading; it does not replace it.
Warning: do not start with build on
Ichimoku signals take several candles to develop, and crypto can move sharply before your setup completes. A single wick can liquidate a used position even if the later candle close would have supported your idea.
Use spot or paper trades first. Once you can log at least 30 completed practice trades with entry reason, stop, target and outcome, you will have a fair starting sample for judging whether your rules are working.
Fees also change the math. Binance lists a standard spot maker and taker fee of 0.1000% per side for regular users before discounts (Binance fee schedule, accessed Oct. 4, 2026). If your target is small, two fees plus slippage can erase the edge of a marginal signal.
What is the ichimoku cloud indicator?
The ichimoku cloud is a technical indicator that shows trend direction, momentum, and likely support or resistance on one price chart. It combines five lines into one visual system, helping you judge whether buyers or sellers control the market without switching between several separate tools.
The full Japanese name is often translated as a one-glance equilibrium chart. That goal still fits crypto: you want to see trend bias, momentum and nearby danger zones quickly, especially when Bitcoin or large altcoins move while traditional markets are closed.
Crypto traders like ichimoku because the market never stops. There is no daily exchange close that resets sentiment across all venues. The cloud gives you a structured way to read context, but it should be checked against liquidity, volume and your planned risk.
What ichimoku shows at a glance
The shaded cloud between the two senkou span lines is the first area to check. Price above the cloud usually points to bullish conditions. Price below the cloud usually points to bearish conditions. Price inside the cloud points to indecision, which is where many weak crypto entries happen.
Read the cloud as a support or resistance zone. A thick cloud suggests price has more historical structure to work through. A thin cloud can break more easily, especially during high-volume sessions.
Is ichimoku a leading or lagging indicator?
Ichimoku is both. The senkou spans are plotted 26 periods ahead of current price, which gives the cloud its forward view. The chikou span plots the current close 26 periods back, so it is a lagging confirmation tool.
TradingView documents the built-in ichimoku defaults as 9, 26, 52 and 26 for conversion line, base line, leading span B and lagging span offset (TradingView support, accessed Oct. 4, 2026). Those numbers are a shared language for traders, not a guarantee that every crypto pair will respond cleanly.
The five components of the ichimoku cloud explained
Before you read a trade signal, you need to know what each line is telling you. The ichimoku cloud is built from five components, and each answers a different question about price.
Use this table as your quick reference before moving to the trading steps.
Component | Also called | What it shows | How traders use it |
|---|---|---|---|
tenkan-sen | conversion line | Short-term momentum based on the last 9 periods | Spot early momentum shifts and crossover signals with kijun-sen |
kijun-sen | base line | Medium-term trend strength based on the last 26 periods | Track support, resistance and trailing exit levels |
senkou span A | leading span A | Average of tenkan-sen and kijun-sen, plotted 26 periods ahead | Read the nearer cloud boundary and short-term cloud bias |
senkou span B | leading span B | Midpoint of the last 52 periods, plotted 26 periods ahead | Read the slower cloud boundary and stronger structure |
chikou span | lagging span | Current closing price plotted 26 periods in the past | Confirm whether momentum has room to continue |
tenkan-sen: short-term momentum
The tenkan-sen is the fastest line in the system. It is calculated from the midpoint between the highest high and lowest low over the lookback period, not from an average of closing prices.
On a crypto chart, a rising tenkan-sen above kijun-sen shows short-term buyers are pressing. When it flattens or turns down, momentum is fading. Do not trade from tenkan-sen alone because one volatile candle can distort it.
kijun-sen: baseline trend strength
The kijun-sen uses the same midpoint idea over a longer window, so it reacts more slowly. That slower behavior makes it useful for exits and invalidation.
If price closes below kijun-sen after a strong rally, treat it as an early warning that trend strength is weakening. If kijun-sen is flat, the market is often ranging. If it slopes clearly, trend pressure is building.
senkou span A and senkou span B: the cloud
These two lines form the cloud and are plotted ahead of current price. When senkou span A sits above senkou span B, the cloud is usually colored green. When senkou span B sits above senkou span A, the cloud is usually colored red.
Do not trade cloud color by itself. A green cloud under price is stronger than a green cloud while price is trapped inside the cloud. Location still matters.
chikou span: lagging confirmation
The chikou span plots the current close 26 periods back. Its job is simple: show whether current price has cleared old structure or is running into past congestion.
Before entering, look 26 bars to the left. If the chikou span is buried in old candles or wicks, your trade may hit resistance quickly. If it has clear space, the setup has a better path.
Step 1: add ichimoku cloud to your crypto chart
Now put the indicator on your screen. These steps use TradingView because its menu layout is familiar to most crypto traders.
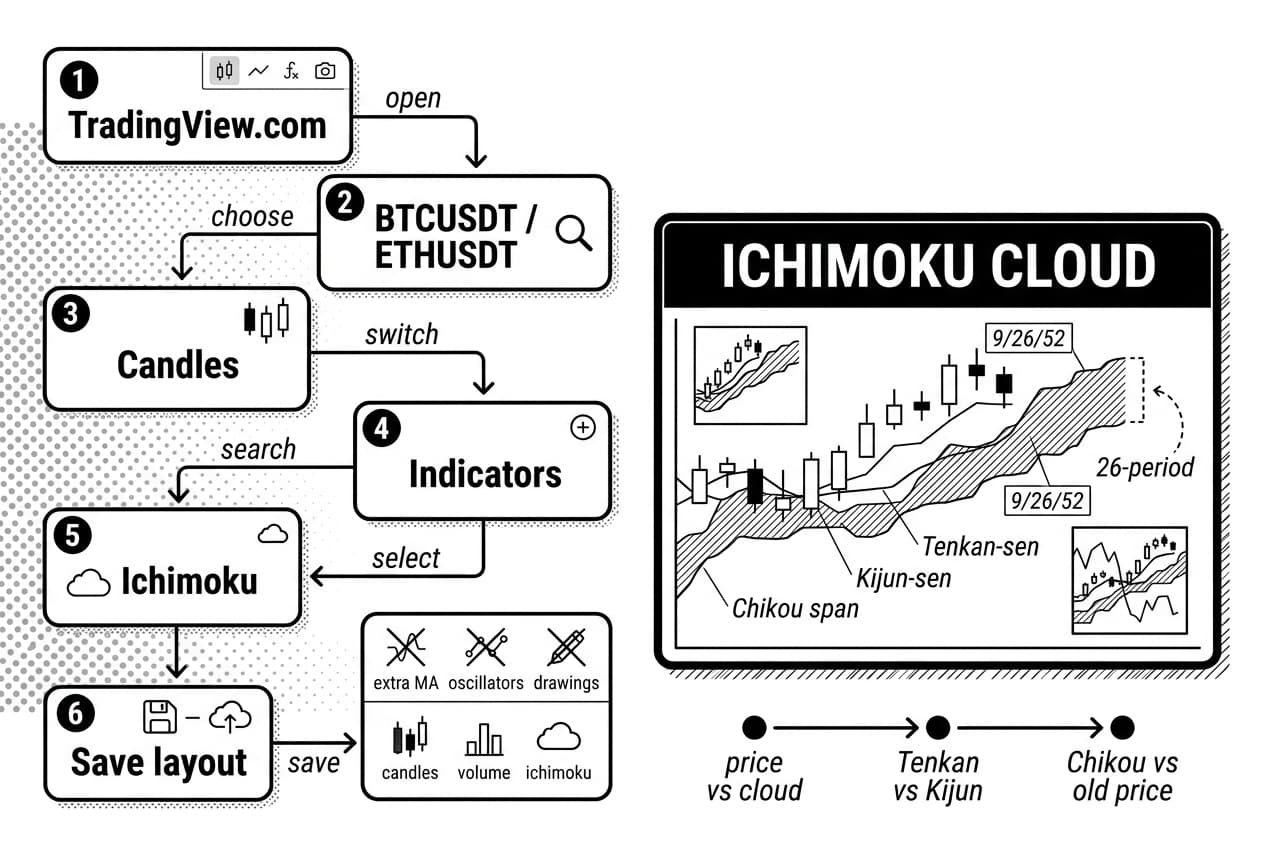
- Open TradingView: go to TradingView.com and log in.
- Select a crypto pair: click the symbol search box in the top-left area, type BTCUSDT or ETHUSDT, then choose a liquid exchange feed.
- Switch to candles: click the chart type icon in the top toolbar and select Candles.
- Open Indicators: click Indicators in the top toolbar.
- Search ichimoku: type ichimoku, then select Ichimoku Cloud from the built-in indicators list.
- Save the layout: click the layout name or cloud-save control so you do not rebuild the chart each session.
After the indicator loads, you should see price candles, a shaded cloud, tenkan-sen, kijun-sen and chikou span. If the chart looks crowded, hide every nonessential indicator until you can read these parts clearly.
Use default settings first
Start with the default 9/26/52 settings and the 26-period displacement. These defaults let you compare your chart with most education examples and public scripts.
Changing settings before you understand the default signals creates confusion. Learn the base behavior first, then test faster or slower versions later.
Pro tip: clean up your chart
Remove extra moving averages, oscillators and drawings while you learn. Keep only candles, volume and ichimoku.
A clean layout helps you see three relationships quickly: price versus cloud, tenkan-sen versus kijun-sen, and chikou span versus old price. Add other tools back only after those reads become natural.
Step 2: read trend direction with the cloud
With the ichimoku cloud on your chart, start with one question: where is price relative to the cloud? That single check gives your first trend bias before you study any crossover.
Identify bullish conditions
A bullish setup needs price above the cloud, a rising or supportive cloud, and senkou span A above senkou span B. When all three line up, buyers have the cleaner path.
Wait for a candle close above the cloud rather than reacting to an intrabar wick. In crypto, wicks through cloud edges are common during thin liquidity.
Identify bearish conditions
Bearish conditions are the reverse. Price sits below the cloud, the cloud slopes down or caps rallies, and senkou span A sits below senkou span B.
In that structure, the cloud becomes overhead resistance. Rallies into the cloud are not automatic long entries; they are tests of whether sellers still control the zone.
Warning: avoid cloud chop
Warning: If price repeatedly enters the cloud, exits, and then re-enters from the other side, you are seeing cloud chop. Stand aside until price closes cleanly above or below the cloud.
Cloud chop happens during range-bound markets. It creates attractive but weak crossovers that fail before price reaches a reasonable target.
Use this practical rule: no new trades when price is inside the cloud. Waiting feels boring, but it removes many low-quality setups from your journal.
Step 3: confirm signals with tenkan, kijun and chikou
After you know trend direction, check whether momentum agrees. The tenkan-sen and kijun-sen crossover is the common trigger, but the location of that cross decides whether it is strong, neutral or weak.
Confirm a bullish tenkan-kijun cross
A bullish cross happens when tenkan-sen moves above kijun-sen. Treat it as tradable only when price is above the cloud, the cross occurs above the cloud, and chikou span is above the price from 26 periods ago.
A cross inside the cloud is neutral because price is still in friction. A cross below the cloud is weak unless you have separate reversal evidence, such as a hammer candlestick reversal signal.
Confirm a bearish tenkan-kijun cross
A bearish cross happens when tenkan-sen moves below kijun-sen. The stronger version has price below the cloud, the cross below the cloud, and chikou span below old price.
If the bearish cross occurs while price is still above the cloud, treat it as a caution signal, not an automatic short. In a strong uptrend, those crosses can mark a pullback rather than a reversal.
Use chikou to filter bad trades
The chikou span is the part many beginners skip. Do not skip it. It tells you whether current price is clear of past congestion.
For a cleaner read, look for at least five to seven candles of open space around the chikou span. If it is pressing into a prior range, resistance or support may stop the trade early.
Apply the Location-Direction-Space framework before every entry. Location: where is price and the cross relative to the cloud? Direction: do tenkan-sen, kijun-sen and the cloud agree? Space: does chikou span have room away from old candles?
Mini evidence log: how to record one setup
Use a simple trade-journal transcript so your review is based on evidence, not memory.
Pair: BTC/USDT
Time frame: 4H
Location: price closed above cloud
Direction: tenkan-sen above kijun-sen; cloud green
Space: chikou span above old candles
Entry rule: wait for candle close, then place stop before entry
Result field: fill after exit, not before
This is not a promise that BTC/USDT will behave a certain way. It is a repeatable record format that helps you build a dataset from your own trades.
Step 4: build an ichimoku cloud trading strategy
Reading the ichimoku cloud correctly is only half the job. The other half is turning that read into a plan with entry, stop, target, position size and review rules.
Ichimoku cloud strategy steps
- Identify the trend: check whether price is above, below or inside the cloud on your chosen time frame.
- Wait for confirmation: require tenkan-sen and kijun-sen to align with your trade direction.
- Check chikou: confirm the chikou span has cleared old candles and nearby structure.
- Plan the entry: enter only after the candle closes and all trigger conditions are true.
- Set the stop: define the exact invalidation level before you place the order.
- Define the target: mark partial-profit and full-exit areas before entry.
- Size the position: risk only a small preset share of your account based on stop distance.
- Journal the trade: record setup, entry, stop, target, fees, outcome and lesson.
Define your entry trigger
A complete long trigger can read like this: price closes above the cloud, tenkan-sen crosses above kijun-sen, chikou span sits above price from 26 periods ago, and breakout volume is above its recent average. If one condition is missing, wait.
Pairing ichimoku with bullish candle pattern confirmation can improve your evidence stack. The candle should support the same direction as the cloud signal.
Place your stop-loss
Your stop marks where the trade idea is wrong. For a long trade, common stop zones are below kijun-sen, below the cloud, or below the most recent swing low.
For a short trade, flip the logic: stop above kijun-sen, above the cloud, or above the most recent swing high. Choose the method before entry and do not move the stop farther away after the trade starts.
Plan your exit before entering
Exit rules protect you from improvising under stress. Three practical options are partial profit at prior resistance, trailing the stop behind kijun-sen, or exiting when price closes back inside the cloud.
An opposite tenkan-kijun cross can also be an exit trigger, especially on the 4-hour, daily or weekly chart. Write the exit rule in your journal before you enter.
Pro tip: account for fees and funding
Spot fees are only one cost. Perpetual futures may add funding payments, and Binance states that funding for USD-M perpetual contracts is commonly settled every 8 hours, although intervals can vary by contract (Binance futures funding FAQ, accessed Oct. 4, 2026). Add entry fee, exit fee, estimated slippage and funding before judging reward-to-risk.
Step 5: choose the best ichimoku settings by time frame
No single setting is best for every crypto asset, exchange and holding period. Your job is to start with sensible inputs, then test whether those inputs match the market you trade.
Default 9/26/52 settings: the right place to start
The default 9/26/52 settings remain the best learning base because most examples, chart templates and public discussions refer to them. That shared reference helps you compare your read with other traders.
A 2023 peer-reviewed paper tested technical trading rules on cryptocurrency data using 75 cryptocurrencies in its sample (MDPI research paper, 2023). The useful lesson for beginners is not that one setting always wins. It is that crypto results vary by asset and rule design, so you should test instead of assume.
Faster settings for lower time frames
Scalpers sometimes test 5/10/20 or 7/22/44 on 1-minute, 5-minute and 15-minute charts. Faster settings react sooner, but they also produce more false signals.
If you use faster settings, require volume confirmation and a higher-time-frame trend filter. Without those filters, small wicks can trigger repeated entries and exits.
Slower settings for swing trading
Swing traders sometimes test 20/60/120 to smooth noise on 4-hour, daily and weekly charts. Slower settings reduce weak crossovers, but they also confirm later.
Use slower settings to define the bigger trend, then drop to a lower time frame for entry timing if your plan allows it. Do not change settings mid-trade.
Settings comparison table
The table below gives starting points for testing. These are not guaranteed best settings; treat them as hypotheses for your own paper trading and backtesting.
Trading style | Typical time frame | Tenkan / kijun / senkou B | Main advantage | Main risk |
|---|---|---|---|---|
Scalping | 1m, 5m, 15m | 5 / 10 / 20 or 7 / 22 / 44 | Faster signal response | More false signals on thin volume |
Day trading | 15m, 1H, 4H | 9 / 26 / 52 | Widely referenced and easier to learn | Late signals during fast intraday moves |
Swing trading | 4H, daily, weekly | 20 / 60 / 120 | Filters noise and reduces weak crossovers | Later entries and missed early trend legs |
If you are newer to the ichimoku cloud, spend a few weeks on the daily chart with 9/26/52 before experimenting. Once the default behavior is familiar, you can judge whether a setting change improves decisions or only changes the noise.
Step 6: avoid common ichimoku mistakes in crypto
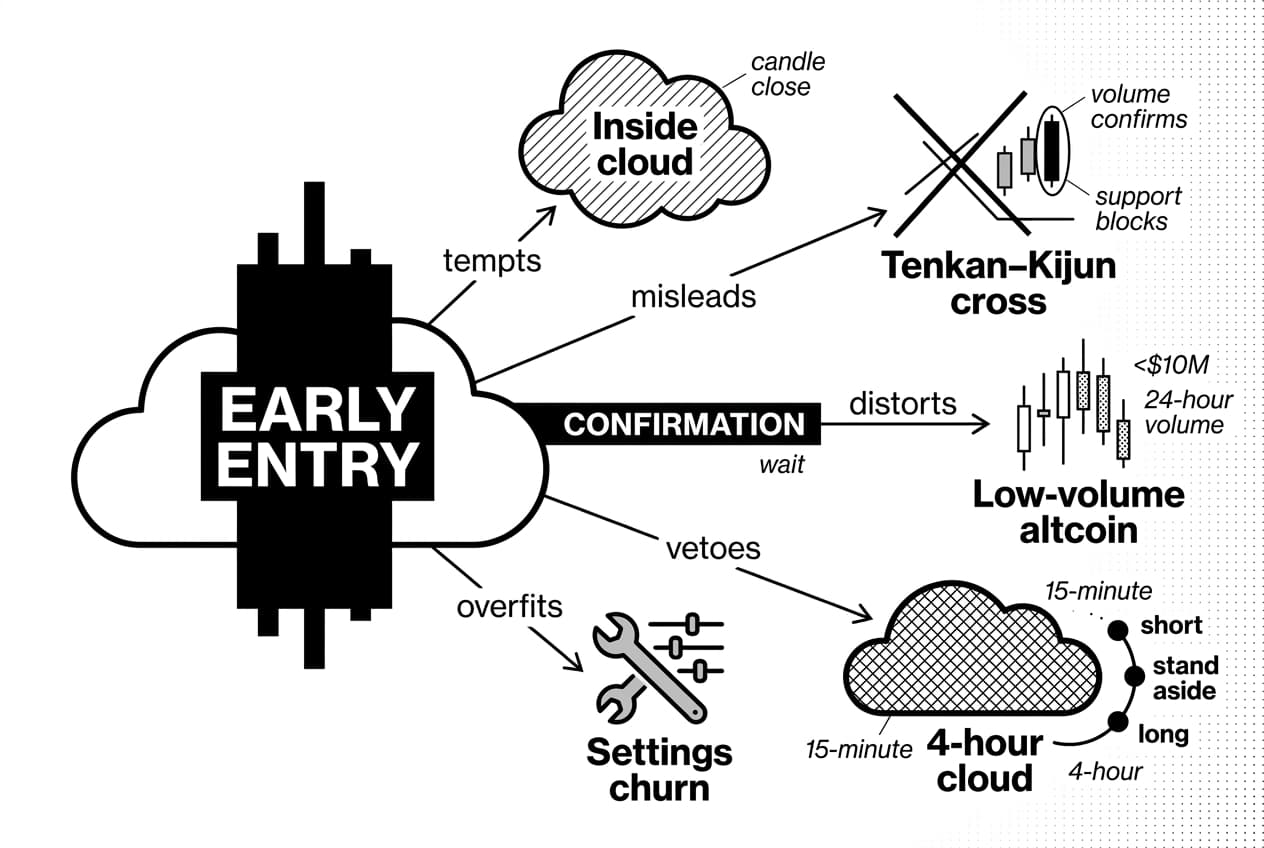
Most ichimoku mistakes come from acting too early. Crypto volatility makes early signals look exciting, but confirmation is what keeps you out of weak trades.
Warning: trading inside the cloud
Price inside the cloud means the market has not chosen direction. Do not open a new trade there. Wait for a confirmed candle close outside the cloud.
Do not trade every crossover
A tenkan-kijun crossover is a condition, not a full signal. Price must be on the correct side of the cloud, volume should support the move, and nearby support or resistance should not block the path.
A bullish cross inside or below the cloud has less value than a bullish cross above the cloud. Pair crossovers with reversal candlestick patterns when you need extra confirmation.
Warning: illiquid altcoins
Low-volume altcoins can print erratic candles that distort tenkan-sen, kijun-sen and the cloud. As a practical filter, avoid applying ichimoku to assets with less than $10 million in 24-hour volume unless you have a separate liquidity model.
Check the higher time frame
A 15-minute long signal means little if the 4-hour cloud is thick, red and above price. The higher time frame should have veto power over lower-time-frame entries.
Use this rule: if the 4-hour trend is bearish, only take short setups on the 15-minute chart. If the 4-hour trend is bullish, only take long setups. If the higher time frame is inside the cloud, stand aside or reduce activity.
Warning: over-optimizing settings
Do not keep changing inputs until old trades look perfect. That usually creates a curve-fit setup that fails in live conditions.
Also watch for a bearish hammer candlestick signal at cloud resistance after a weak crossover. It can show that buyers are losing energy before the trade reaches your target.
Backtest before you risk capital
Paper trading is slow, but it gives you evidence. Track at least 20 to 50 sample trades before using real money, then review win rate, average win, average loss, maximum drawdown, fees and rule violations.
Your paper-test dataset should include these fields: date, pair, time frame, settings, cloud location, crossover direction, chikou clearance, entry price, stop price, target, fee estimate, result and lesson. This turns subjective chart reading into a reviewable process.
Use outside context sparingly. Lyn Alden can help you think about macro liquidity, while Willy Woo can help you study on-chain behavior. Neither source should override your stop-loss or turn a failed signal into a hold-and-hope trade.
Warning: expecting guaranteed profits
No crossover, cloud breakout or chikou confirmation guarantees a win. Ichimoku is a filter for probability. Position sizing and stop placement decide whether losses stay manageable.
Frequently Asked Questions
- Is Ichimoku Cloud a leading indicator?
- Ichimoku is a hybrid. Senkou Span A and B are plotted 26 periods ahead, giving a projected support and resistance zone, while Chikou Span trails price as lagging confirmation. This forward-plotted cloud offers useful context, but it reflects probability — not a guaranteed prediction of future price movement.
- Which indicator is best for day trading?
- There is no single universal answer. Day traders commonly pair trend tools like Ichimoku with volume, RSI, MACD or candlestick patterns for confirmation. The right combination depends on your time frame, the asset you trade, current market conditions and your personal risk management rules.
- What is the most powerful trading strategy?
- Power comes from process, not a specific setup. A reliable strategy defines clear entry criteria, invalidation levels, position sizing and risk/reward targets. Ichimoku can be a strong component of that framework, but every strategy should be thoroughly backtested before you risk any real capital on it.
- What are the best settings for Ichimoku Cloud?
- The standard 9/26/52 settings are the best starting point because they are widely recognized and well-documented. Some crypto traders experiment with faster settings to suit 24/7 markets, but any adjustment must be properly backtested across different conditions to avoid overfitting to recent price history.
- Why is Ichimoku the best indicator?
- Many traders value Ichimoku because it combines trend direction, momentum, support/resistance and trade confirmation in a single view. That said, no indicator is universally best. Ichimoku performs well in trending markets but can generate unreliable signals during prolonged sideways chop, so context always matters.
- What is the success rate of Ichimoku?
- There is no fixed success rate. Performance varies based on the asset, time frame, settings, trading fees, execution quality and risk management. Any published win rate figure should be treated with skepticism. Calculate your own results through backtesting and paper trading before drawing conclusions.
- Which time frame is best for Ichimoku?
- Higher time frames like the 4-hour, daily and weekly charts typically produce cleaner, more reliable Ichimoku signals with less noise. Shorter time frames can work for day trading, but signals become choppier. A practical approach is to confirm overall trend direction on a higher time frame before entering on a lower one.
Sources
Author

Crypto analyst and blockchain educator with over 8 years of experience in the digital asset space. Former fintech consultant at a major Wall Street firm turned full-time crypto journalist. Specializes in DeFi, tokenomics, and blockchain technology. His writing breaks down complex cryptocurrency concepts into actionable insights for both beginners and seasoned investors.