Doji Candle Pattern Guide: How to Read Market Indecision
Doji Candle Pattern Guide: How to Read Market Indecision
What Is a Doji Candle Pattern?
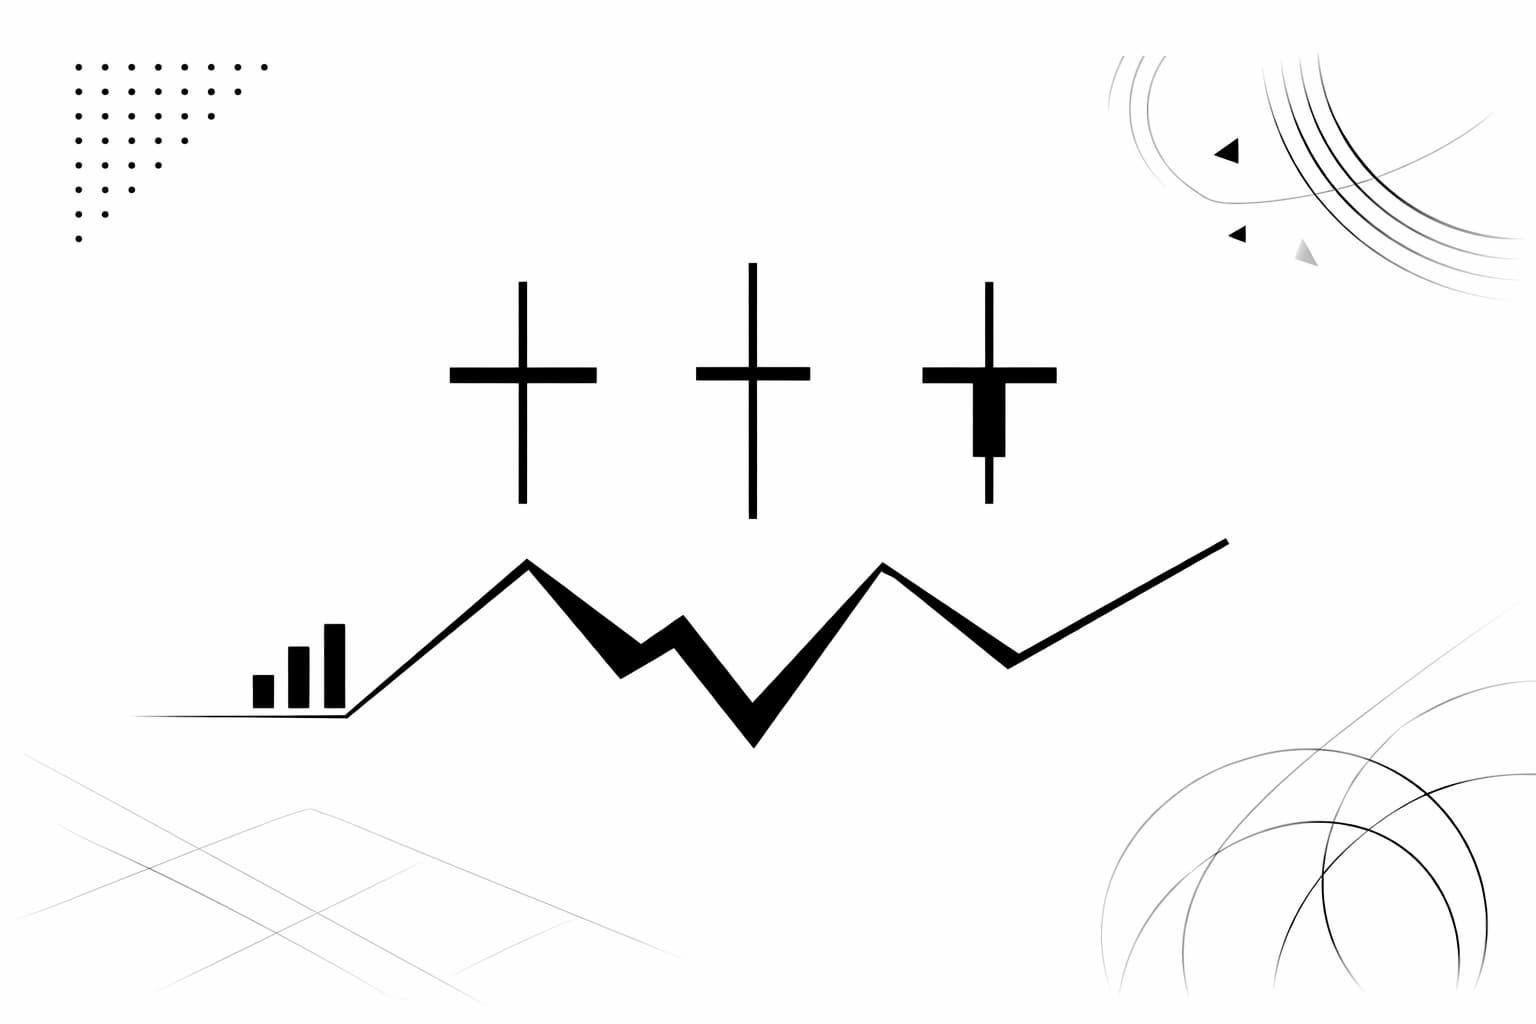
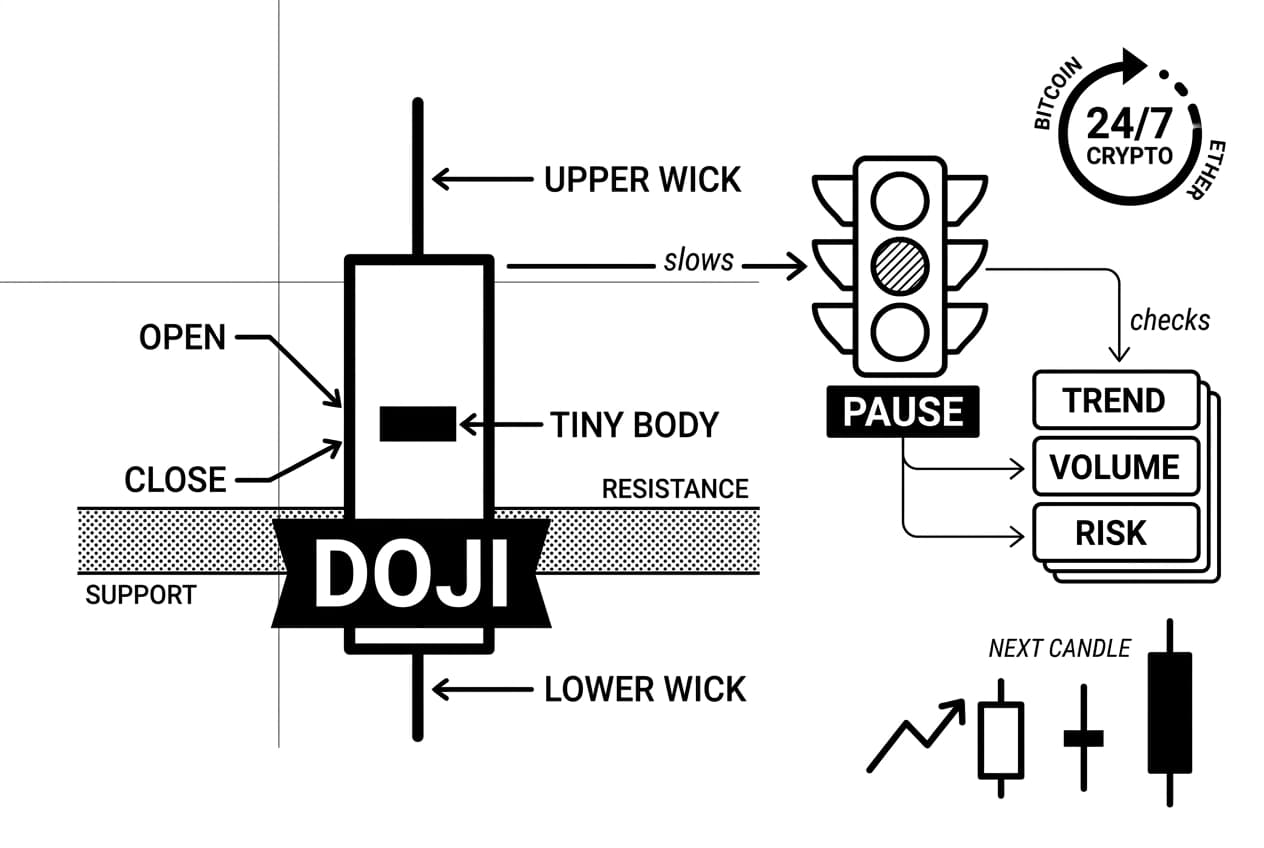
A doji candle pattern forms when the open and close are nearly the same, creating a candle with a tiny or invisible body and upper or lower wicks that show price moved during the period before settling near its starting point.
Why It Matters
For crypto traders, a doji matters because it marks a pause in conviction. It does not say buy or sell by itself. It says that the previous push may need a second look. That is especially useful in crypto, where bitcoin, ether, and altcoins trade 24 hours a day, 7 days a week (Coinbase, accessed July 24, 2026) and a new candle begins immediately after the last one closes.
Think of a doji as a yellow traffic light on a fast road. It does not tell you to turn left or right. It tells you to slow down, check the intersection, and avoid guessing before the next signal appears.
The common shortcut is to call every doji a reversal signal. A better crypto-first view is more cautious: a doji is usually a volatility checkpoint. Its value comes from trend direction, nearby support or resistance, confirmation from the next candle, volume, and risk controls.
Background and Anatomy of a Doji Candlestick
A candlestick is a chart symbol that summarizes price activity during one time period. It uses 4 price points: open, high, low, and close (Binance spot API documentation, accessed July 24, 2026). The open is where the period began. The close is where it ended. The high is the highest traded price, and the low is the lowest traded price.
How the Open and Close Create the Doji Shape
The thick middle part of a candle is the real body. It measures the distance between open and close. The thin lines above and below are wicks, also called shadows. Wicks show how far price moved beyond the open and close before returning.
For a simple teaching example, suppose BTC opens at $60,000 and closes at $60,020 during a one-hour candle. The body is only $20 wide, so it looks almost flat. If price also traded as high as $61,500 and as low as $58,800, the candle would have long wicks on both sides. The message is not that buyers or sellers won. The message is that both sides tested the range and neither held control by the close.
This is different from candles created by smoothing methods such as heikin ashi candles. Smoothed candles can be useful for trend reading, but they can hide the exact open-close relationship that makes a doji meaningful.
A Brief History of Candlestick Analysis
Candlestick charting developed in Japan before modern electronic markets. Traders used candle shapes to summarize price behavior and sentiment before screens, APIs, and automated alerts existed. Today, the same idea appears on crypto exchanges, stock platforms, and futures charts: one candle condenses a period of trading into a shape that humans can compare quickly.
Our July 2026 Doji Checkpoint Worksheet
To avoid treating the doji candle pattern as a magic signal, we use a simple decision-support worksheet. The method relies on raw OHLC data. A public kline endpoint can return 12 fields per candle, including open time, open, high, low, close, and volume (Binance spot API documentation, accessed July 24, 2026).
Teaching dataset created July 24, 2026: the rows below are not a backtest or performance claim. They show how to classify candles using the same rule set every time.
sample candle | open | close | high | low | body as share of range | classification |
|---|---|---|---|---|---|---|
A | $60,000 | $60,020 | $61,500 | $58,800 | 0.7% | long-legged doji candidate |
B | $3,000 | $3,004 | $3,006 | $2,930 | 5.3% | dragonfly-style doji candidate |
C | $0.420 | $0.421 | $0.455 | $0.419 | 2.8% | gravestone-style doji candidate |
D | $100.00 | $100.00 | $100.00 | $100.00 | 0% | four-price doji candidate |
Decision log, 2026-07-24: 1. Measure body = absolute close minus open. 2. Measure range = high minus low. 3. If body is tiny compared with range, mark a doji candidate. 4. Do not trade the candidate until location, confirmation, volume, and risk are checked.
This worksheet is the article's core framework: L-C-R-V, short for location, confirmation, range, and volume. Location asks where the candle formed. Confirmation asks what the next candle did. Range asks whether the wicks show real testing or just noise. Volume asks whether participation was meaningful.
Main Types of Doji Candles and What They Suggest
Not all doji candles carry the same message. The shape of the wick tells you where the market tested price before returning near the open. The table below gives a quick reference, then the sections explain how to read each type without overreacting.
doji type | visual shape | common interpretation | best context |
|---|---|---|---|
standard doji | small cross with roughly balanced wicks | quiet balance between buyers and sellers | any trend, but only useful with confirmation |
dragonfly doji | long lower wick with little or no upper wick | sellers pushed price down, then buyers recovered it | after a downtrend, near support |
gravestone doji | long upper wick with little or no lower wick | buyers pushed price up, then sellers erased the move | after an uptrend, near resistance |
long-legged doji | long wicks above and below the body | wide volatility with no clear winner | around news, liquidations, or major levels |
four-price doji | single horizontal line with no visible wick | open, high, low, and close are the same | illiquid markets or inactive trading periods |
Dragonfly doji
A dragonfly doji has a long lower wick and little or no upper wick. The open and close sit near the top of the candle. During the period, sellers pushed price lower, but buyers brought it back before the close. This can matter after a downtrend, especially at a clear support zone, but it still needs confirmation.
Gravestone doji
A gravestone doji is the opposite shape. It has a long upper wick and little or no lower wick, with the open and close near the bottom. Buyers lifted price during the candle, but sellers took control before the close. It can warn of buyer fatigue after a rally, especially near resistance.
Long-legged and standard doji
A long-legged doji has long wicks on both sides. It shows that price moved sharply up and down before ending near the open. In crypto, this often appears around high-volatility windows, large liquidation moves, or major news. A standard doji is quieter. It has shorter, more balanced wicks and usually says only that momentum paused.
Is a Doji Bullish or Bearish? It Depends on Context
A doji is not bullish or bearish by default. Its meaning depends on where it appears. The same candle can warn of buyer exhaustion after an uptrend or seller fatigue after a downtrend.
Doji After an Uptrend: Possible Buyer Exhaustion
When a doji forms after a strong rally, it can show that buyers no longer have easy control. Price may have pushed higher during the candle, but the close near the open says the market rejected part of that move. The signal becomes more useful near a double top chart pattern or another clear resistance zone.
Doji After a Downtrend: Possible Seller Fatigue
After a sharp decline, a doji can show that sellers struggled to extend the move. Buyers may be starting to respond at lower prices. The useful part is not the candle alone. The useful part is whether the next candle closes above the doji high with acceptable volume and a defined stop-loss level.
Support, Resistance, and Trend Lines: Why Location Amplifies the Signal
Support is a price area where buyers have stepped in before. Resistance is a price area where sellers have appeared before. A doji near support or resistance matters more than a doji in the middle of a random range, because the candle is appearing where the market has already shown interest.
A doji near a double bottom bullish reversal setup, for example, adds one more piece of evidence to an existing support story. It does not complete the trade plan by itself.
For broader market context, Lyn Alden, founder of Lyn Alden Investment Strategy, is useful because her work focuses on liquidity, macro cycles, and asset structure. That perspective fits doji analysis: a candle signal is stronger when it agrees with the larger market setting, and weaker when it fights it.
A 2021 peer-reviewed finance paper indexed on ScienceDirect found that candlestick signals were more useful when evaluated with trend context rather than as isolated shapes (ScienceDirect, 2021). That supports the practical rule in this guide: first read the setting, then read the candle.
- After an uptrend: a doji may suggest buyer exhaustion, especially near resistance.
- After a downtrend: a doji may suggest seller fatigue, but only confirmation gives it weight.
- At support or resistance: the signal is more relevant because the location already matters.
- In the middle of chop: the signal is often noise.
How to Use a Doji Candle Pattern in Crypto Trading
Spotting the shape is only the first step. A safer process turns the doji candle pattern into a decision-support tool rather than a trigger.
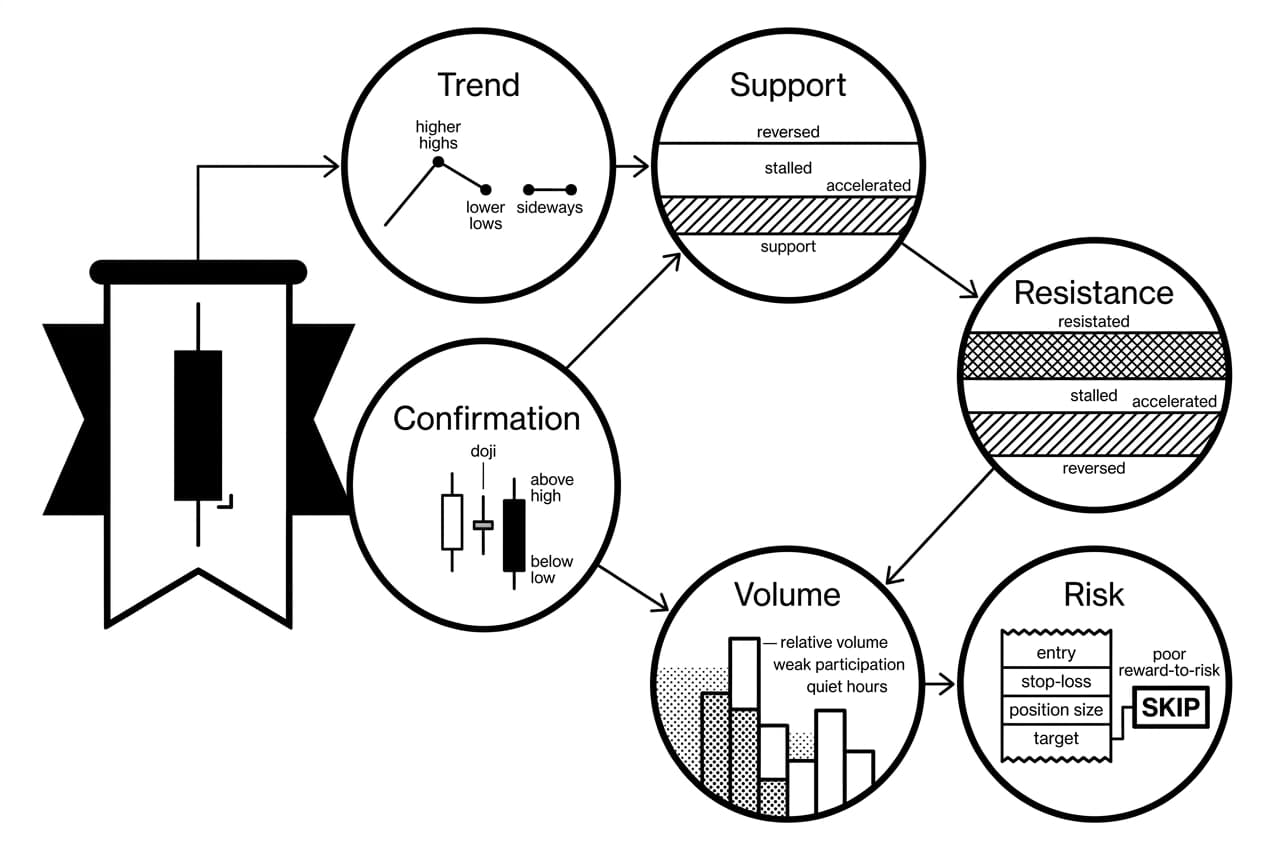
- Identify the trend. Decide whether price is making higher highs and higher lows, lower highs and lower lows, or moving sideways. Trend gives the candle its first layer of meaning.
- Mark support and resistance levels. Draw horizontal zones where price previously reversed, stalled, or accelerated. A doji at a known level deserves more attention than one in open space.
- Spot the doji. Check whether the open and close are nearly the same. Then classify the wick structure as standard, dragonfly-style, gravestone-style, long-legged, or four-price.
- Wait for confirmation. A bullish confirmation is usually a later candle closing above the doji high. A bearish confirmation is usually a later candle closing below the doji low.
- Check volume. Volume means the amount traded during the candle. Relative volume compares current activity with a recent average. A doji with weak participation should be treated with more doubt.
- Manage risk before entry. Plan the entry, stop-loss, position size, and target before placing a trade. If the reward-to-risk math is poor, skip the setup.
Step 3: Use Volume and Relative Volume Carefully
Crypto does not have a single daily closing bell. Weekend, overnight, and holiday activity can be thinner than weekday activity. A doji that forms during quiet hours may reflect poor liquidity rather than a meaningful fight between buyers and sellers. Cross-check volume before trusting the candle.
A Quick Risk Note
A doji at support is not a buy signal. It is a watch signal. If the next candle fails to confirm, or if volume is weak, the setup should usually be ignored. Willy Woo, on-chain analyst, is relevant here because his public work emphasizes market data and on-chain behavior. That data-first habit is the right mindset for candle patterns too.
For more pattern-based setups you can pair with this process, see candlestick patterns for intraday trading.
The doji candle pattern is a clue, not a prediction machine. A repeatable process turns that clue into a usable trading decision.
Doji vs Spinning Top, Harami, and Other Similar Patterns
Doji candles are easy to confuse with nearby patterns. The difference usually comes down to body size and the number of candles involved.
Doji vs spinning top
A spinning top has a small but visible real body. Its open and close are close, but not nearly identical. A doji has an open and close so close together that the body almost disappears. Both show indecision, but a doji is the cleaner indecision signal.
Doji vs harami
A harami is a two-candle pattern. The second candle is contained inside the range or body of the prior candle, depending on the charting definition used. A doji is a one-candle pattern based on the open-close relationship. A doji can appear inside a harami setup, but the labels are not interchangeable.
pattern | body size | number of candles | typical interpretation |
|---|---|---|---|
doji | tiny or nearly invisible body | 1 | clear indecision; needs context |
spinning top | small but visible body | 1 | moderate indecision; weaker than a doji |
harami | second candle is contained by the first candle | 2 | momentum is slowing; possible pause or reversal |
Getting the label right matters because a trader who mistakes a spinning top for a doji may overstate the signal. A trader who treats every doji inside a larger two-candle structure as a separate trade may also miss the broader setup.
Limitations and Risk Management When Trading Doji Candles
Even a textbook doji candle pattern can fail. In crypto, false signals are common because trading never stops, liquidity changes by hour, and derivatives liquidations can create sudden wicks.
Why Doji Signals Fail
- Sideways markets: when price chops sideways, doji candles can appear again and again with little meaning.
- Low liquidity: thin order books can create dramatic wicks without broad market agreement.
- Exchange-specific wicks: if the wick appears on one venue only, it may be a local data or liquidation event.
- Forced liquidation moves: crypto perpetual futures can create fast spikes that look technical but are driven by forced exits.
- Macro or policy news: major rate, inflation, legal, or exchange news can overpower a candle setup immediately.
Single-candle patterns are most fragile when they appear without confirmation. A doji at a key level is worth watching, but not worth trusting blindly.
A Beginner-Friendly Risk Checklist
Use the L-C-R-V filter before acting on a doji:
- Location: did the doji form after a clear move and near support or resistance?
- Confirmation: did the next candle close beyond the doji high or low?
- Range: do the wicks show real testing, or is the candle simply noise in a tight market?
- Volume: was participation at least normal for that asset and time of day?
- Stop-loss: do you know the exact price where the setup is wrong?
- Position size: is the trade small enough to survive if it fails?
For a broader look at how these controls fit into a complete trading approach, see our guide to crypto chart patterns and risk rules.
Many traders cap risk at 1% to 2% of account equity per trade as a beginner-friendly guardrail (Investopedia, accessed July 24, 2026). The exact number is personal, but the principle is not: decide the loss before entering the trade.
Key Takeaways
The Doji Candle Pattern in One Minute
A doji forms when the open and close are nearly the same. It shows that buyers and sellers ended the candle near balance, even if price moved sharply during the period. The doji candle pattern is most useful when it appears at a meaningful level, receives confirmation, and fits a defined risk plan.
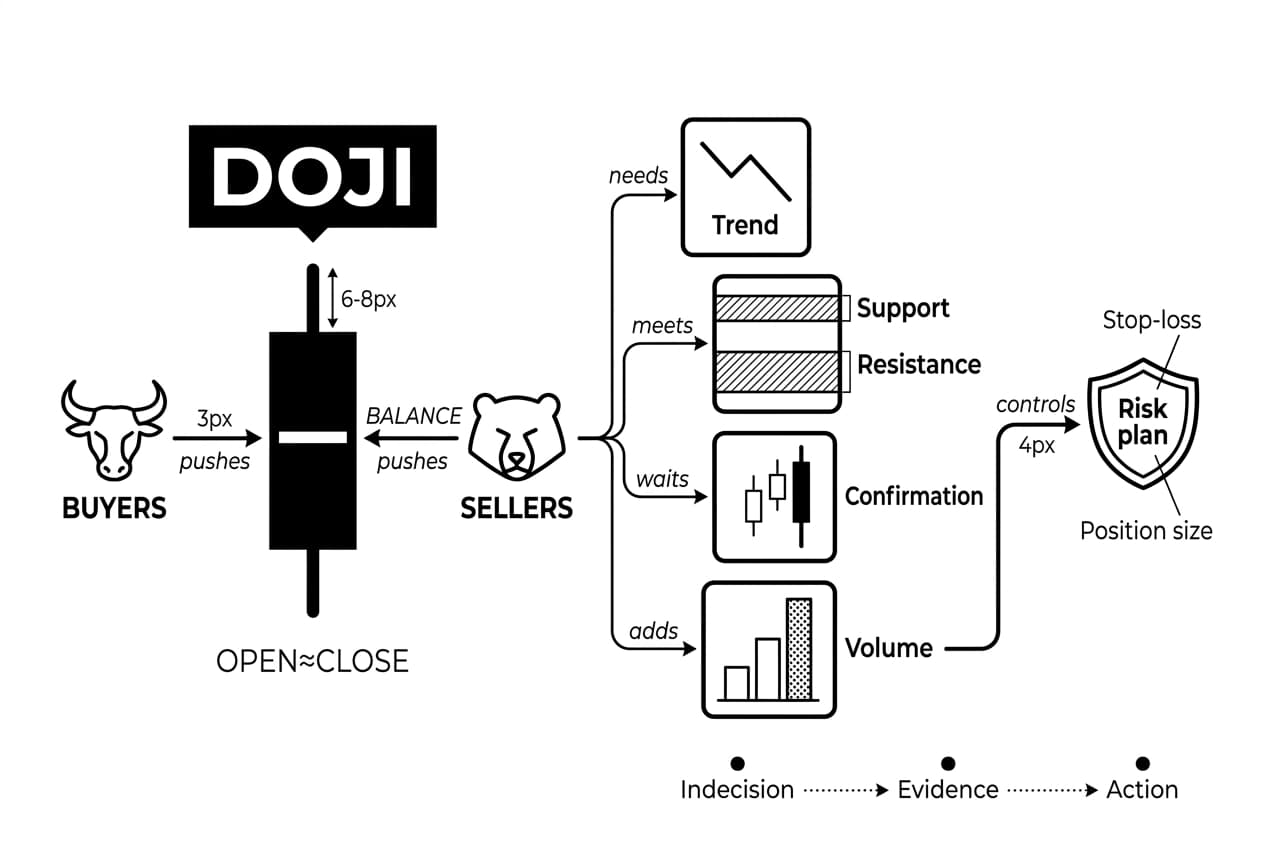
- Indecision, not prediction: a doji shows balance between buyers and sellers. It does not forecast the next move alone.
- Context comes first: trend, support, resistance, and time of day shape the signal.
- Confirmation matters: wait for the next candle to support the idea before acting.
- Volume adds evidence: higher participation makes a doji more meaningful than a thin-market wick.
- Risk rules decide survival: stop-loss placement and position sizing matter more than memorizing candle names.
Frequently Asked Questions
- What happens after a doji?
- Nothing is guaranteed after a doji. Price can reverse, continue in the same direction, or drift sideways. To judge whether the doji carries real weight, traders look at the next candle, nearby support and resistance levels, volume, the broader trend, and any relevant market news.
- What does a doji candle symbolize?
- A doji candle symbolizes indecision in the market. It forms when the open and close prices are nearly identical, leaving a very small or nonexistent body. During that period, both buyers and sellers pushed price in their favor, but neither side gained a clear advantage by the close.
- Which doji is bullish?
- The dragonfly doji is generally considered the most bullish doji pattern, particularly when it appears after a downtrend or near a known support level. It shows sellers pushed price lower but buyers pushed it back up by the close. Still, confirmation from the following candle is important before acting on it.
Sources
Author

Crypto analyst and blockchain educator with over 8 years of experience in the digital asset space. Former fintech consultant at a major Wall Street firm turned full-time crypto journalist. Specializes in DeFi, tokenomics, and blockchain technology. His writing breaks down complex cryptocurrency concepts into actionable insights for both beginners and seasoned investors.