Pepe Coin Price Prediction 2026: Data, Scenarios, Risks

Pepe Coin Price Prediction 2026: Data, Scenarios, Risks
Pepe Coin Price Prediction 2026: Key Finding
The central finding for a pepe coin price prediction 2026 is that market-cap math matters more than the token's low nominal price. As of July 2026, PEPE trades near $0.0000132 with a market cap near $5.56 billion and a fixed circulating supply of 420,690,000,000,000 tokens (CoinGecko, July 2026). That supply makes eye-catching retail targets such as $0.01 or $0.50 far harder than they look on a price chart.
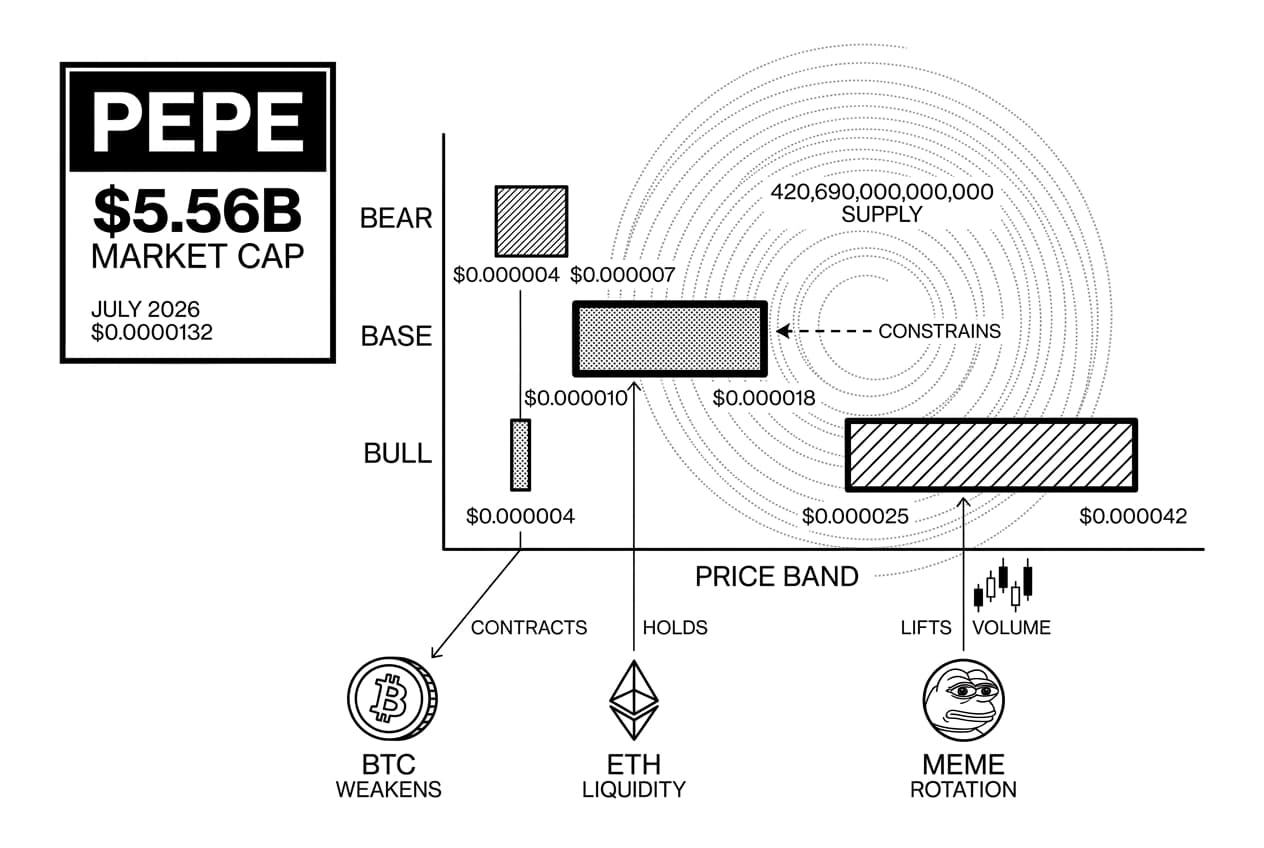
This forecast uses scenario bands rather than a single target. The base case places PEPE in a broad $0.000010-$0.000018 range for the second half of 2026, assuming crypto liquidity holds and meme-coin volume does not collapse. The bear case falls to $0.000004-$0.000007 if BTC weakens and speculative volume contracts. The bull case reaches $0.000025-$0.000042 only if a new meme-coin rotation lifts sector-wide market caps and PEPE captures a larger share of that flow.
For valuation context, this article references the public on-chain research work of Willy Woo, on-chain analyst. WooCharts is useful here because high-supply speculative assets need to be judged against liquidity, volume and market-cap comparables, not just against a token-level price target. This is not financial advice; it is scenario analysis based on dated public market data that should be refreshed before publication or trade execution.
Base-case view for July-December 2026
The base case assumes BTC avoids a major risk-off break, ETH liquidity remains supportive for ERC-20 trading, and PEPE keeps tier-1 exchange liquidity. Under those conditions, PEPE is more likely to trade in a wide range than to follow a smooth upward line. A move from $0.0000132 to $0.000018 would imply roughly 36% gross upside before fees, while a drop to $0.000010 would imply roughly 24% gross downside, using the July 2026 reference price from CoinGecko, July 2026.
What would invalidate the forecast
Three conditions would force the scenario bands lower. First, a BTC drawdown of 30% or more from mid-cycle levels would likely compress meme-coin valuations faster than large-cap crypto assets. Second, a sustained volume contraction of 40% or more from the July 2026 PEPE spot-volume baseline would reduce reliable price discovery. Third, any loss of major exchange liquidity would widen spreads and make the bull scenario harder to support. If any of those events occur, the bear range becomes the primary working range rather than the downside tail.
By the Numbers: PEPE Data Points to Check in 2026
The data below is a publication checklist, not a permanent dataset. Meme-coin metrics can change materially within days, so each figure should be refreshed directly at the source before the article goes live.
- Reference price: about $0.0000132 (CoinGecko, July 2026).
- Market cap: about $5.56 billion (CoinGecko, July 2026).
- Fully diluted valuation: about $5.56 billion because the circulating supply is effectively the full supply (CoinMarketCap, July 2026).
- Circulating supply: 420,690,000,000,000 PEPE (CoinGecko, July 2026).
- 24-hour trading volume: about $420 million (CoinMarketCap, July 2026).
- Volume-to-market-cap ratio: about 7.5%, calculated from the $420 million volume and $5.56 billion market-cap inputs above (CoinMarketCap, July 2026).
- All-time high reference: about $0.00002825, leaving the July 2026 reference price roughly 53% below the peak (CoinMarketCap, July 2026).
- Spot fee baseline: Binance standard spot fees are listed at 0.1% per side before discounts (Binance fee schedule, July 2026).
A fully circulating supply is important. PEPE does not have a large future vesting cliff that must be absorbed by buyers, but it also lacks a built-in supply squeeze. The supply side of the model is mostly fixed; the demand side does nearly all the work.
Metrics that matter most
This article applies an original PEPE three-gate market-cap test. The test asks three questions before accepting any price target: what market cap does the target imply, what liquidity would be needed to support that cap, and what sector share would PEPE need relative to other meme coins?
Metric | What to check | Why it matters |
|---|---|---|
Market cap vs. meme peers | PEPE's rank against DOGE, SHIB and newer meme tokens | Rotation capital usually moves toward the most liquid names first |
Volume-to-market-cap ratio | Sustained readings above 10% | High ratios show active speculation, but spikes can reverse fast |
CEX and DEX liquidity depth | Order-book depth and Uniswap liquidity within a tight price band | Thin books amplify both rallies and drawdowns |
Whale concentration | Top wallet share and 30-day changes on public block explorers | Rising concentration can raise distribution risk |
RSI | 14-day readings above 70 or below 30 | Momentum extremes are useful warning signals, not guarantees |
50-day and 200-day averages | Whether price is above both trend lines | Trend-following traders often use these levels for entries and exits |
The practical test is simple: a PEPE target is not credible unless its implied market cap can be compared with real historical caps, its volume can support the move, and the meme-coin sector is large enough to fund it.
Calculation transcript for the scenario model
The following author calculation log converts the July 2026 supply input into the price bands used in this forecast. It is included so readers can audit the math rather than rely on a black-box target.
Input or output | Value | Source or method |
|---|---|---|
Circulating supply | 420,690,000,000,000 PEPE | CoinGecko, July 2026 |
Base-case low cap | About $4.21B | $0.000010 x 420.69T supply, author calculation, July 2026 |
Base-case high cap | About $7.57B | $0.000018 x 420.69T supply, author calculation, July 2026 |
Bull-case high cap | About $17.67B | $0.000042 x 420.69T supply, author calculation, July 2026 |
One-cent cap | About $4.21T | $0.01 x 420.69T supply, author calculation, July 2026 |
How to read PEPE ROI correctly
Quoting returns from PEPE's 2023 lows can mislead 2026 buyers. Your actual return begins at your own entry price. If the July 2026 reference price is $0.0000132, a rise to $0.000018 is not a thousand-percent trade; it is roughly 36% before trading fees, slippage, taxes and funding costs.
Fees matter most for small positions. Binance lists a standard spot fee of 0.1% per side before discounts (Binance fee schedule, July 2026). Ethereum DEX trades can also face variable gas costs and slippage. The forecast ranges in this article describe gross price movement only. Net ROI depends on venue, order size, execution quality and whether the position uses spot or derivatives.
PEPE Overview and Historical Context
PEPE is an ERC-20 meme token launched in April 2023 with a fixed supply of 420,690,000,000,000 tokens (CoinGecko, July 2026). It has no protocol revenue, staking yield or governance function comparable to utility-focused crypto assets. Its price is driven mainly by liquidity, exchange access, social attention and risk appetite. For a fuller origin timeline, see our PEPE launch history and early price timeline.
From launch to major exchange listings
PEPE's early activity was concentrated on decentralized exchanges before large centralized venues added support in 2023. Exchange access mattered because it reduced friction for retail traders and increased visible liquidity. The token later reached an all-time high near $0.00002825 before retracing to the July 2026 reference area near $0.0000132 (CoinMarketCap, July 2026). That boom-and-retracement pattern is typical for meme assets: volume often rises first, price follows, and late-cycle holders absorb the drawdown when attention rotates elsewhere.
Why meme coins trade differently
Meme tokens are reflexive. Rising prices create social attention, social attention attracts new buyers, and new buyers can extend the move. The same loop works in reverse when volume fades. PEPE has often moved faster than larger meme peers during risk-on windows because its market cap is smaller than DOGE's, but that same smaller base can lead to sharper percentage drawdowns. In this structure, exchange depth and wallet distribution are more useful than narratives alone.
PEPE Technical Overview: Trend, Momentum and Levels
Technical indicators cannot make PEPE predictable, but they can show whether buyers or sellers control the current range. For a separate chart-led treatment, see our PEPE technical analysis and scenario forecast.
SMA, EMA and RSI signals
When PEPE trades above both its 50-day and 200-day simple moving averages, trend-following traders usually read that as a constructive setup. A close below both averages would weaken the base case. The 20-day exponential moving average is useful for shorter swings because meme tokens can move quickly after a pullback. RSI readings above 70 suggest crowded momentum, while readings below 30 suggest capitulation risk or an early accumulation zone, depending on volume confirmation.
Support, resistance and breakout confirmation
The most useful resistance zone is the prior high area that pushed PEPE's market cap above roughly $8.3 billion in early 2026 (CoinGecko, February 2026 reference). A breakout above that zone needs volume confirmation. A practical rule is to require daily volume at least 1.5 times the 30-day average before treating a breakout as durable. Without that confirmation, a move above resistance is more likely to be a liquidity sweep than a new trend. For broader setup context, see the crypto chart patterns and risk rules guide.
PEPE price prediction for today and the next 30 days
For the July-August 2026 window, the useful question is not an exact daily target. It is whether PEPE is in continuation or mean reversion. If BTC and ETH hold their ranges, PEPE can remain supported by broad risk appetite. If BTC falls 10%-12% from current levels, PEPE would likely fall by more because meme tokens tend to have higher beta during drawdowns. That short-term setup does not change the year-end framework; it only shifts the probability weight between bear, base and bull cases.
PEPE Coin Price Prediction 2026: Bear, Base and Bull Scenarios
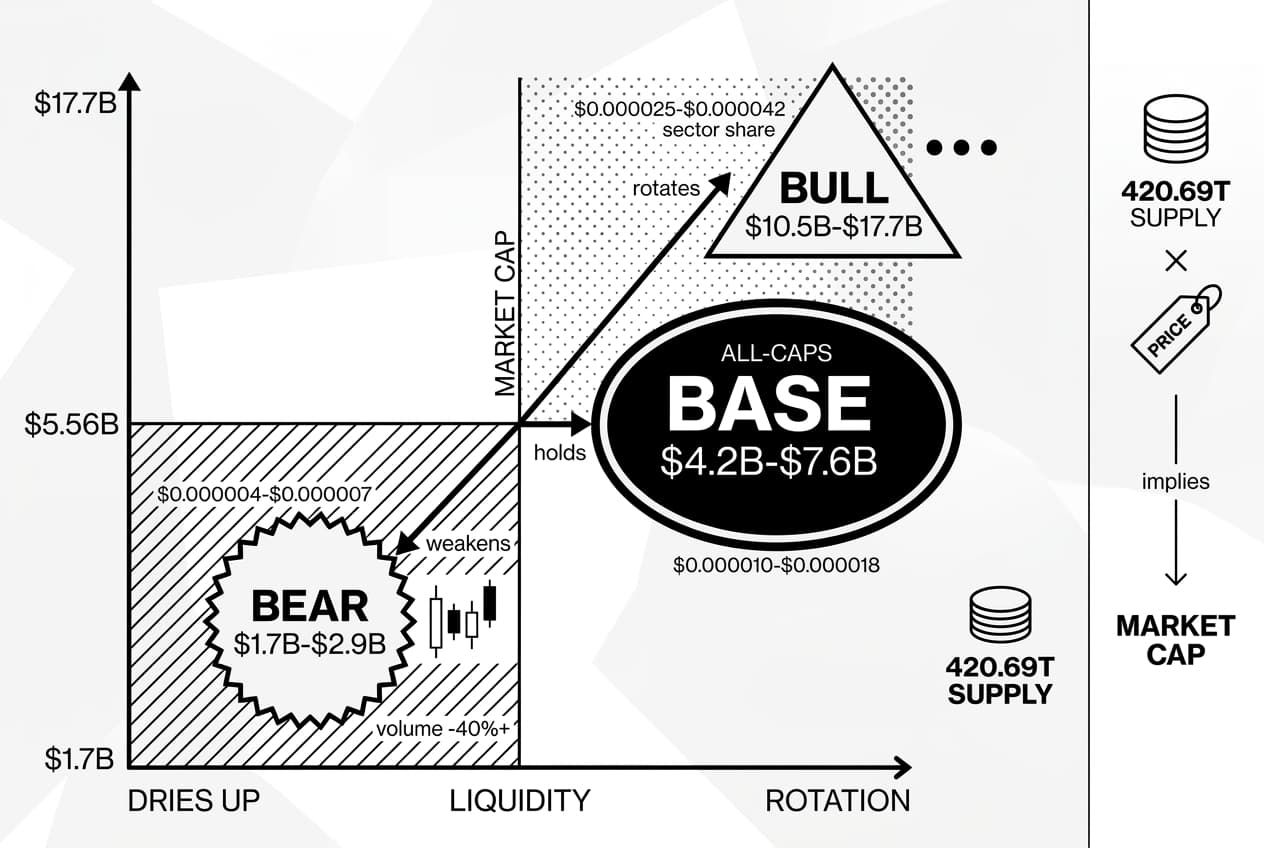
The scenario table below is the core forecast. It uses the fixed supply of 420.69 trillion tokens and the formula implied market cap = price target x circulating supply. Figures should be updated with live July 2026 data before publication.
Scenario | 2026 Price Range | Implied Market Cap | Key Assumption |
|---|---|---|---|
Bear | $0.000004-$0.000007 | $1.7B-$2.9B | BTC weakens; meme volume drops 40%+ |
Base | $0.000010-$0.000018 | $4.2B-$7.6B | Crypto liquidity holds; PEPE tracks broad beta |
Bull | $0.000025-$0.000042 | $10.5B-$17.7B | New meme rotation; PEPE gains sector share |
Bear scenario
The bear case requires a mix of weakening BTC, falling meme-token volume and reduced social interest. At $0.000004-$0.000007, PEPE's implied market cap would fall to about $1.7B-$2.9B. Against the July 2026 market cap near $5.56B (CoinGecko, July 2026), that would imply a drawdown of roughly 48%-69%. This outcome is not extreme for a meme token if liquidity dries up.
Base scenario
The base case assumes PEPE acts like a high-beta mid-cap crypto asset: it follows the market rather than creating a new independent cycle. The $0.000010-$0.000018 range implies a $4.2B-$7.6B market cap. This is the most defensible forecast range if BTC remains stable, ETH liquidity holds, and PEPE keeps its major exchange access without a fresh viral catalyst.
Bull scenario
The bull case needs several conditions at once: rising total crypto market cap, a meme-coin sector rotation, stronger CEX volume, and PEPE gaining share against peer meme assets. If PEPE reaches $0.000025-$0.000042, its market cap would be about $10.5B-$17.7B. That is demanding but still inside a historical meme-coin comparison set, unlike $0.01 or $0.50 targets.
PEPE prediction table: July to December 2026
The monthly ranges below are scenario-weighted estimates. They should not be read as guaranteed minimum, average and maximum prices.
Month | Minimum bear case | Base case | Maximum bull case |
|---|---|---|---|
July 2026 | $0.000006 | $0.000012 | $0.000020 |
August 2026 | $0.000005 | $0.000013 | $0.000025 |
September 2026 | $0.000005 | $0.000014 | $0.000028 |
October 2026 | $0.000006 | $0.000015 | $0.000033 |
November 2026 | $0.000006 | $0.000016 | $0.000038 |
December 2026 | $0.000007 | $0.000018 | $0.000042 |
Investors comparing smaller meme-token scenarios may also find the smaller PEPE-themed token forecast useful because it applies similar market-cap math to a lower-liquidity asset.
Catalysts and Risks That Could Move PEPE in 2026
Scenario ranges only hold if the assumptions behind them hold. The main variables are BTC direction, ETH liquidity, exchange access, meme-sector market share, whale distribution and regulatory pressure.
Bullish catalysts
- BTC and ETH expansion: If BTC sustains risk-on conditions and ETH liquidity improves, PEPE can benefit because it is an ERC-20 token with high retail recognition.
- Meme-sector rotation: If capital rotates from older large-cap winners into liquid meme tokens, PEPE could gain share without needing a protocol-specific catalyst.
- Exchange liquidity: More exchange depth can reduce slippage and make larger positions easier to enter or exit.
- Social attention: Tracking PEPE engagement on social-data platforms such as LunarCrush, July 2026 can help identify whether price movement is backed by attention or by thin-volume noise.
Downside risks
- Whale concentration: If large wallets distribute into thin books, price can fall faster than spot volume alone would suggest.
- BTC correlation: PEPE is unlikely to decouple during a market-wide drawdown. A 30% BTC fall would likely push meme tokens into deeper percentage losses.
- Regulatory pressure: Restrictions on retail access, exchange listings or derivatives venues could reduce liquidity quickly.
- Smart-contract and custody risk: PEPE holders face ERC-20 contract risk and centralized-exchange counterparty risk. Readers focused on custody should review why self-custody matters for crypto holders.
- Liquidity gaps: Stop losses may execute poorly during fast sell-offs, especially outside peak trading hours.
Regulatory risk and whale concentration are the hardest variables to model because they can change before public traders see the data. For a broader holding-risk view, see our analysis of whether PEPE is dead in 2026.
Can PEPE Reach 1 Cent or $0.50?
PEPE can reach $0.01 only if its market cap equals price x circulating supply, or about $4.21 trillion at the current 420.69 trillion token supply. A $0.50 target implies about $210.35 trillion. Those targets require extreme assumptions far beyond any realistic 2026 meme-coin model.
Market-cap reality check
The formula is straightforward: implied market cap = target price x circulating supply. PEPE's supply of 420,690,000,000,000 tokens (CoinGecko, July 2026) turns small-looking token prices into very large valuations.
Price target | Implied PEPE market cap | Comparison |
|---|---|---|
$0.00002 | About $8.4B | Slightly above the July 2026 base-case range |
$0.0001 | About $42.1B | Below DOGE's 2021 peak near $88B (CoinGecko, 2021 peak reference) |
$0.001 | About $420.7B | Larger than most crypto assets have ever sustained |
$0.01 | About $4.21T | Above the total crypto market cap peak near $3.7T (CoinMarketCap, January 2026 reference) |
$0.50 | About $210.35T | Far beyond current global equity-market scale |
The $0.01 target spreads because it sounds small. In market-cap terms, it is not small. It would require PEPE alone to exceed the largest total crypto-market valuation cited above. A more grounded bullish question is whether PEPE can reach $10B-$40B of market cap during a peak meme cycle. That maps to about $0.000024-$0.000095, which is aggressive but at least comparable to prior meme-coin valuations.
Key Takeaways for Investors
PEPE is a high-volatility meme asset. The best 2026 forecast is not a single number; it is a probability-weighted range tied to liquidity and market-cap thresholds. At the July 2026 reference price near $0.0000132, the base case is $0.000010-$0.000018, the bear case is $0.000004-$0.000007, and the bull case is $0.000025-$0.000042. The $0.01 and $0.50 targets do not fit realistic market-cap constraints under current supply conditions.
What to watch next
- BTC trend: Bitcoin's direction sets the main risk-on or risk-off backdrop.
- PEPE spot volume: Sustained daily volume above recent averages matters more than a one-day spike.
- Market-cap rank: Rank changes on CoinMarketCap, July 2026 can show whether capital is rotating into or out of PEPE.
- Weekly RSI: Readings above 70 warn of crowded momentum; readings below 30 suggest stress or accumulation.
- Support and resistance: Confirmed weekly closes matter more than intraday wicks.
- Meme-sector breadth: If DOGE, SHIB and other large meme names weaken together, PEPE's bull case becomes less likely.
Frequently Asked Questions
- Where will Pepe be in 5 years?
- By 2031, PEPE's value will hinge on whether it stays culturally relevant, retains strong exchange liquidity, and holds meaningful meme-coin market share. In a bullish scenario it could multiply significantly; in a bearish one it fades into obscurity. Long-term meme-coin forecasts carry unusually high uncertainty compared to utility tokens.
- How high can Pepe go?
- PEPE can surge sharply during risk-on meme cycles, as seen with DOGE and SHIB at their peaks. However, every price target must be weighed against the implied market capitalization its enormous supply creates. Higher price targets quickly demand valuations that dwarf even the largest historical meme-coin milestones, so temper expectations accordingly.
- Will Pepe coin reach 1 cent in 2030?
- With PEPE's circulating supply, $0.01 per token implies a market capitalization in the hundreds of billions of dollars. Reaching that level would require massive overall crypto market expansion and sustained meme-coin demand over years. It is not mathematically impossible, but it only becomes plausible under the most aggressive and optimistic assumptions imaginable.
- Will Pepe reach 0.5 dollar?
- At $0.50, PEPE's implied market capitalization would run into the quadrillions of dollars, far beyond any realistic valuation in financial history. This target is effectively impossible under current supply conditions. Significant token burns or major supply restructuring could change the math, but absent those changes, $0.50 remains an unrealistic price target.
Sources
Author

Crypto analyst and blockchain educator with over 8 years of experience in the digital asset space. Former fintech consultant at a major Wall Street firm turned full-time crypto journalist. Specializes in DeFi, tokenomics, and blockchain technology. His writing breaks down complex cryptocurrency concepts into actionable insights for both beginners and seasoned investors.