Heikin Ashi Candle Guide: Read Smoother Crypto Charts
heikin ashi candle guide: read smoother crypto charts
By the end of this guide, you will know what a heikin ashi candle shows, how the formula works, where to switch it on, and how to practice with it before risking money. The practical goal is simple: use heikin ashi as a trend filter, then confirm real entries and exits on standard price charts.
Common framing says heikin ashi makes trends cleaner and easier to trade. Our take is stricter. The smoother view is useful only when you remember that averaged open, high, low, and close values can hide true gaps, exact fills, and fast reversals.
What you'll learn about a heikin ashi candle
This guide walks you through the full workflow for reading a heikin ashi candle on a live crypto chart. You will learn the formula, the platform setup, the main visual signals, and a repeatable practice routine that turns chart watching into a recorded process.
For information gain, use the article's original LAG check: lag, actual price, and gaps. Before acting on any smoothed candle, ask whether the signal is late, whether the displayed value matches the real market price, and whether a standard chart shows a gap that heikin ashi has blended away.
Two market notes set the context. TradingView reported more than 50 million registered users in May 2023, which is why this guide uses TradingView-style menu language. Bitcoin also traded above $90,000 during November 2024 according to CoinGecko, November 2024, showing why crypto traders need chart tools that separate trend from noise without hiding execution risk.
Who this guide is for
You will get the most from this guide if you are a beginner to intermediate crypto trader, chart reader, or long-term investor who wants cleaner trend visualization without dropping risk management. You do not need advanced technical analysis. You do need to know what a normal candlestick's open, high, low, and close mean.
If you already trade with standard candles and feel that noise makes trends hard to read, heikin ashi is worth testing. Treat it as one view of market pressure, not as a trade signal by itself.
Prerequisites: what you'll need before you start
Before you plot a heikin ashi candle, set up three basics: a charting tool, a market to watch, and a way to record practice trades. Getting these ready first prevents formula confusion and keeps you from clicking into live orders before you understand what the smoothed chart is showing.
Understand OHLC, the raw ingredients
Every standard candle and every heikin ashi candle built from it depends on four price points per period. Open is where the period started. High is the highest traded price. Low is the lowest traded price. Close is where the period ended.
The heikin ashi formula recalculates these values using averages. If those four inputs are fuzzy in your mind, the chart will feel mysterious even though the math is short.
A practical fee note matters before any chart setup turns into a trade. Major exchange spot fees can sit around 0.05% to 0.10% on high-volume venues, but the exact rate depends on the exchange, account tier, and token discounts, so check live schedules through CoinGecko, accessed July 2026 and the exchange's own fee page before placing orders.
Choose a charting platform
A TradingView-style interface is the easiest starting point. Open the chart, find the candle icon in the top toolbar, click it, and choose heikin ashi from the chart type list. On exchange charts, open the settings gear or chart style menu near the top of the price panel.
- TradingView-style charts: best for multi-timeframe review, watchlists, and indicator stacking.
- Exchange charts: convenient when you are close to execution, but often weaker for drawing tools.
- Mobile apps: useful for monitoring, but not ideal for building a clean indicator layout.
Pick a market and timeframe
BTC, ETH, and high-liquidity altcoins all work with heikin ashi, but they do not behave the same way. Bitcoin often forms cleaner 4-hour and daily trends because liquidity is deeper. Smaller altcoins can flip colors more often because thinner order books exaggerate moves.
Start with the 4-hour or daily chart. The 1-hour chart is workable once you have practice. The 5-minute chart is where beginners often overtrade because the smoothing cannot remove every rapid reversal.
Willy Woo is included here as an approved on-chain analyst reference for the broader principle that crypto noise rises on shorter horizons. Use that principle carefully: the shorter your timeframe, the more confirmation you should require before trusting a heikin ashi color change.
Step 1: understand what a heikin ashi candle shows
A heikin ashi candle is a modified candlestick that uses averaged OHLC data calculated partly from the previous candle instead of displaying the exact open and close for each period. Because each candle depends on prior values, the chart smooths price action and makes trend direction easier to see.
That smoothness is useful, but it has a cost. The open and close shown on a heikin ashi candle are not always prices where the market actually opened or closed. If you place an order from the displayed heikin ashi close, your real fill may be different.
heikin ashi vs standard candlestick charts
The table below shows the core difference between the two chart types. If standard candles still feel unfamiliar, read candlestick patterns for intraday trading before you rely on smoothed candles.
Feature | Standard candlestick | heikin ashi |
|---|---|---|
Price source | Actual open, high, low, and close for the period. | Averaged values based on current and prior candle data. |
Trend readability | Can look choppy during normal pullbacks. | Shows cleaner same-color candle sequences during trends. |
Entry precision | Better for exact entries and exits. | Weaker for execution because values are smoothed. |
Gaps | Shows real gaps and sudden opens clearly. | Can blend gaps into a smoother visual path. |
Best use case | Order timing, pattern confirmation, and real price checks. | Trend filtering, momentum review, and holding discipline. |
Know why the candles look smoother
Averaging the current candle and anchoring the open to the prior heikin ashi candle removes much of the random period-to-period noise that makes standard charts look jagged. In a strong uptrend, you may see a long run of green heikin ashi candles while the standard chart shows several small red interruptions.
Use that cleaner run to judge direction, not to guess the exact next tick. The chart reacts after price data exists, so it will always be later than raw price during a sharp reversal.
Step 2: calculate the heikin ashi formula
You do not need to calculate every candle by hand. TradingView, Binance, and most exchange charts do it automatically once you choose the chart type. Still, knowing the math helps you understand why the chart lags and why the displayed prices differ from live fills.
Here are the four formulas in extraction-friendly form:
- HA Close: (current open + current high + current low + current close) ÷ 4
- HA Open: (prior HA open + prior HA close) ÷ 2
- HA High: maximum of current high, HA open, and HA close
- HA Low: minimum of current low, HA open, and HA close
Read the close formula
The HA close averages all four raw price points from the current period. One extreme wick no longer dominates the closing value, so the candle body reflects a smoother center of trading activity rather than only the final traded price.
Read the open formula
The HA open is where most of the smoothing comes from. It uses the midpoint of the prior heikin ashi open and close, not the current market open. That backward link creates cleaner trends and delayed reversals at the same time.
Warning: the first visible candle on any chart needs a starting value. Platforms can handle that starting point differently depending on loaded history, which is why two charts can show slightly different early heikin ashi candles. Investopedia documents the same formula structure in its heikin ashi primer, updated 2023.
Read the high and low formulas
The HA high selects the largest value among the real high, HA open, and HA close. The HA low selects the smallest value among the real low, HA open, and HA close. This is why wicks can look compressed compared with standard candles.
Do not ignore those wicks. A long heikin ashi upper wick means the real high was strong enough to remain visible after smoothing. A long lower wick carries the same warning on the downside.
Step 3: switch your chart to heikin ashi
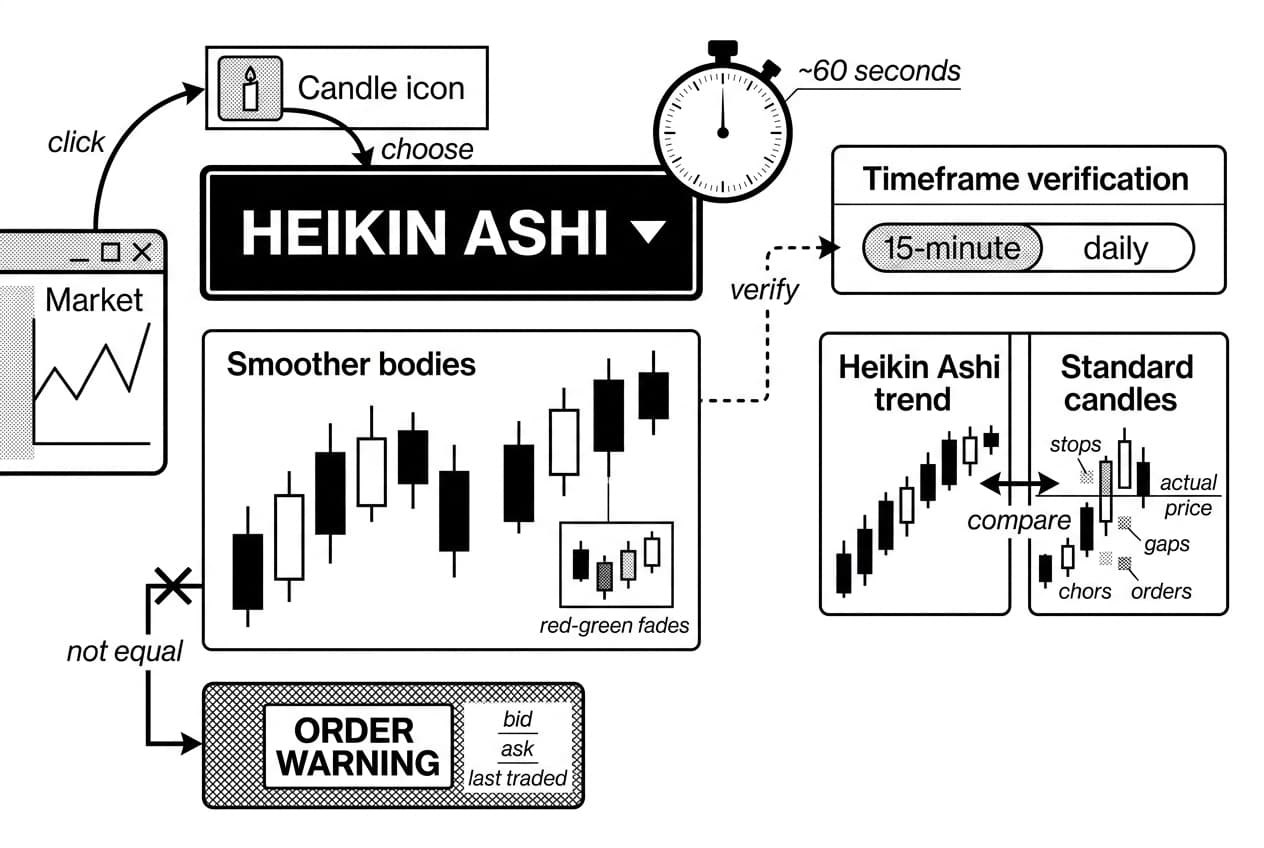
Now put the formula to work on a live or historical chart. This takes about 60 seconds on most major platforms, but you should still slow down and verify the chart type before reading signals.
Set the candle type
Open the market you want to study. Click the candle icon near the top-left toolbar. In the dropdown, choose heikin ashi. The candles should redraw immediately, with smoother bodies and fewer rapid red-green alternations.
Confirm the timeframe in the top bar before moving on. A heikin ashi candle on a 15-minute chart can say something very different from a daily candle, even on the same asset.
Keep a standard chart nearby
This is where many beginners make their first expensive mistake. Because heikin ashi values are averaged, the close shown on the candle may not equal the current bid, ask, or last traded price.
Warning: never place a limit or market order from a heikin ashi price alone. Before entering or exiting, switch back to standard candlesticks or open a split view with both charts visible.
A simple setup is two tabs or two panels. Use heikin ashi for trend direction and the standard chart for actual price, stops, gaps, and order placement.
Step 4: read trend signals on a heikin ashi chart
Once your chart is displaying heikin ashi candles, focus on body size, wick location, and color sequence. These visual cues are more useful than a single candle color in isolation.
Here are the five main signals to recognize:
- Strong bullish trend: green candles print with large bodies and little or no lower shadow.
- Strong bearish trend: red candles print with large bodies and little or no upper shadow.
- Weakening momentum: candle bodies shrink after a same-color run.
- Indecision: small bodies appear with longer shadows on both sides.
- Possible reversal: color changes after shrinking bodies or indecision candles.
Identify bullish trend conditions
A healthy uptrend often shows consecutive green candles with wide bodies and very small lower shadows. The missing lower shadow matters because it suggests buyers kept pressure on the market throughout the period after smoothing.
Use this signal near confirmed support, not after a vertical move into resistance. A late green candle can tempt you to buy the end of a move, especially when the standard chart already shows exhaustion.
Identify bearish trend conditions
Strong bearish conditions show consecutive red candles with large bodies and little or no upper shadow. That missing upper shadow suggests recovery attempts are weak after the formula smooths the period.
These candles are more useful when they appear near a known resistance area. For example, they can add confirmation when a double top chart pattern is already breaking down on a standard chart.
Spot indecision and possible reversals
When bodies shrink and both wicks expand, momentum is stalling. You may see green, red, and green again without a clean run. That is not a fresh trend. It is a warning to slow down.
A color change after this phase is worth watching, but it is not enough by itself. Pair it with a structure signal such as a double bottom chart pattern before you consider a bullish reversal setup.
Pro tip: do not trade the first candle that changes color. Wait for a second candle in the new direction or a separate confirmation signal. This buffer accepts the lag instead of pretending it does not exist.
Step 5: confirm heikin ashi signals with other indicators
Candle color gets you only part of the way. Your edge comes from requiring a small set of confirmations so the smoothed signal does not stand alone.
Use moving averages for direction
A 50-period or 200-period moving average gives you broader trend context. If price is above the 200-period average and heikin ashi candles print strong green bodies with no lower wicks, both tools point in the same direction.
When they disagree, pause. Green heikin ashi candles below a falling 200-period average may be only a relief rally. Pair this approach with crypto chart patterns and risk rules so moving averages do not replace structure.
Use RSI or momentum tools carefully
RSI measures whether momentum is extended. It does not tell you to buy or sell by itself. An RSI reading above 70 during a strong heikin ashi uptrend may mean the move is mature, not that it must reverse immediately.
Use RSI to adjust conviction and position size. Do not use it to overrule trend, structure, and actual price at the same time.
Use support, resistance, and volume
A green heikin ashi candle directly below resistance deserves caution. Check whether volume is rising with the move and whether the standard chart has already rejected the level.
For ETH charts, map Ethereum resistance levels before placing entries. That keeps candle signals tied to market structure rather than color alone.
Use the three-point confirmation rule: trend, momentum, and structure. One trend tool, one momentum tool, and one structural reference point are usually enough. Adding six indicators often creates confidence without adding clarity.
Step 6: practice a simple heikin ashi trading workflow
Before risking capital, turn the method into a paper-trading routine. You are not trying to prove that every signal works. You are trying to learn which market conditions make the signal useful and which ones expose the lag.
Use a liquid pair such as BTC/USDT or ETH/USDT, then lock one timeframe for the full practice period. The 4-hour chart is a good starting point because it reduces intraday noise without forcing you to wait weeks for feedback.
Warning: heikin ashi should never be used to chase used positions or assume compounding gains are guaranteed. The smoothing effect can hide real wicks, and actual price can hit a stop or liquidation level before the smoothed candle looks dangerous.
Build a pre-trade checklist
Run these checks before marking any paper trade:
- Trend direction: are candles the same color with missing lower wicks in an uptrend or missing upper wicks in a downtrend?
- Timeframe alignment: does the daily chart agree with your 4-hour signal?
- Entry trigger: has RSI, an average crossover, or volume confirmed the same direction?
- Stop level: is your stop based on the standard chart's real swing high or low?
- Position size: is your planned risk limited to 1% to 2% of your practice account?
- News check: are macro events, protocol upgrades, or exchange announcements due in the next 24 hours?
Lyn Alden is included as an approved macro and investment strategy reference for process-first market thinking. Your checklist should do the same job: reduce impulse decisions before they reach the order ticket.
Record results before risking capital
Use a paper-trading log of at least 30 completed trades before judging the setup. TradingView's paper trading feature lets free-account users simulate orders from charts, and its help center describes the tool as of January 2026.
For each trade, record the pair, timeframe, signal, entry, stop, target, outcome, and one screenshot note or written observation. After 30 trades, calculate win rate, average loss, average gain, and the setup type that failed most often.
Here is a compact evidence log you can reproduce:
Practice field | What you record | Why it matters |
|---|---|---|
Sample size | 30 paper trades | Prevents judging the method from one lucky chart. |
Chart pair | BTC/USDT or ETH/USDT | Uses liquid markets with cleaner historical data. |
Timeframe | 4-hour or daily | Reduces short-term color flips. |
Lag note | Early, late, or false signal | Measures the main heikin ashi weakness directly. |
After the sample is complete, you will have your own small dataset instead of a borrowed opinion. That is the evidence you need before changing real position size.
Limitations: is the heikin ashi candle reliable?
A heikin ashi candle is reliable for one job: smoothing visual noise so trend direction is easier to inspect. It is less reliable for execution, gap awareness, and fast reversal timing.
Because each candle depends partly on prior values, signals arrive late. A reversal that appears on a standard chart today may only look clear on a heikin ashi chart one or two bars later. In crypto, where liquid assets can move more than 10% in a short window during stress events, that delay matters; use live price pages such as CoinGecko, accessed July 2026 to verify current market conditions.
Where heikin ashi works best
Heikin ashi works best in trending markets. When bitcoin or ETH grinds in one direction, the smoother candles can help you avoid exiting only because one normal candle printed against the trend.
It also helps beginners slow down. A same-color run is easier to review than a noisy standard chart, provided you still confirm execution on real price candles.
Where heikin ashi can mislead you
Sideways markets expose the method's weakness. When price has no direction, averaged values can flip colors repeatedly and create false starts.
News-driven volatility is the other danger zone. A regulatory headline, liquidation cascade, or exchange outage can move price before the smoothed chart fully reflects the risk. In those moments, the LAG check matters most: ask what is late, what the actual price is, and whether a gap has been hidden.
Summary and next steps
You now have the full process. Heikin ashi candles smooth price action by averaging open, high, low, and close data across bars. They make trend direction easier to read, but they can delay reversal signals and hide exact execution prices.
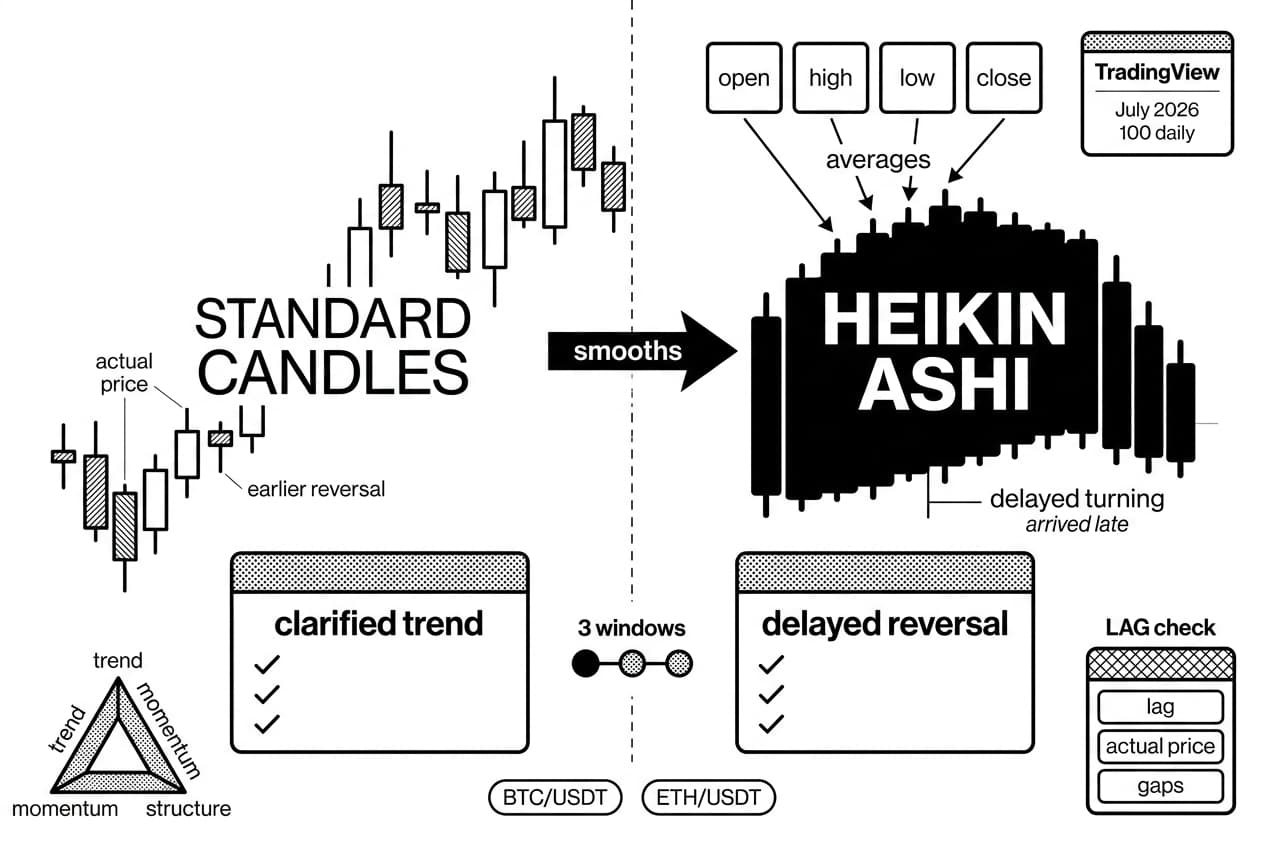
Your next step is not to trade larger. It is to compare chart views. Open a pair you already follow, switch between standard candles and heikin ashi, and write down where smoothing helped and where it arrived late.
Use the three-point confirmation rule before any simulated trade: trend, momentum, and structure. Then use the LAG check before any real trade: lag, actual price, and gaps.
Your next practice exercise
Pick BTC/USDT or ETH/USDT. Open the last 100 daily candles on a standard chart, then switch to heikin ashi and review the same window. Use historical chart tools from TradingView, accessed July 2026 so the date range stays consistent.
Create two columns in your notes. In the first, mark where smoothing clarified the trend. In the second, mark where it delayed a reversal that standard candles showed earlier. Repeat this across three separate windows before you trade live.
Frequently Asked Questions
- Is the Heikin Ashi candle accurate?
- Heikin Ashi candles are accurate as a smoothing calculation, but they do not display the true open and close of any trading period. They work well for reading trend direction, though traders should always cross-reference actual prices on standard candlestick charts before entering or exiting a position.
- What are Heikin Ashi candles good for?
- They are particularly useful for filtering market noise, identifying trend direction, staying in trades longer during strong moves, and spotting early momentum shifts. They are less suitable for precise entries, scalping, or choppy sideways markets where no clear trend exists to follow.
- Which indicator is best with Heikin Ashi?
- No single indicator is universally best, but moving averages, RSI, volume, and support/resistance levels are popular complements. Moving averages help confirm trend direction, RSI measures momentum strength, and support/resistance zones help traders identify where to place and manage their trades.
- Do professional traders use Heikin Ashi?
- Some experienced traders use Heikin Ashi as one chart view or a trend filter, but rarely as their sole decision-making tool. Most professionals combine it with market structure analysis, volatility assessment, liquidity considerations, disciplined risk management, and precise execution data before committing to any trade.
- How accurate is Heikin Ashi?
- Its accuracy depends heavily on how it is used. For smoothing price action and visualizing trends, it performs well. For predicting specific reversals, it is less reliable. Its main limitation is lag, since each candle is built from averaged data that includes the previous Heikin Ashi candle's values.
- Which is better, Heikin Ashi or candlestick?
- Neither is always superior. Standard candlesticks display exact OHLC prices, gaps, and precise entry signals more clearly. Heikin Ashi provides cleaner trend visualization with less visual noise. Many traders keep both chart types open and compare them before committing to a trading decision.
- How to turn 5000 into a million with Heikin Ashi trading?
- Turning $5,000 into a million requires extreme returns that carry equally extreme risk — no chart type makes that realistic or reliable. Rather than chasing shortcuts, focus on backtesting your strategy, applying strict position sizing, setting clear risk limits, and tracking your actual performance honestly over time.
Sources
Author

Crypto analyst and blockchain educator with over 8 years of experience in the digital asset space. Former fintech consultant at a major Wall Street firm turned full-time crypto journalist. Specializes in DeFi, tokenomics, and blockchain technology. His writing breaks down complex cryptocurrency concepts into actionable insights for both beginners and seasoned investors.