Candlestick Pattern for Intraday Trading: 9 Setups to Use

Introduction: build an intraday candlestick playbook
By the end of this guide, you will know how to read a candlestick pattern for intraday trading in context, choose the right chart, confirm the close, size risk, and decide when no trade is the best trade.
Candlesticks are not predictions. Each candle records buyer and seller behavior over a fixed period. A bullish candle on a 5-minute chart shows that buyers controlled that 5-minute window, but the next candle depends on location, trend, liquidity, news, and volume.
The common advice is to memorize dozens of intraday trading chart patterns. A cleaner approach is to master a small group, trade them only at pre-marked levels, and require confirmation before clicking Buy, Long, Sell, or Short in your platform.
For freshness, this guide is written for active markets as of May 2026. It applies to crypto, stocks, futures, indexes, and liquid exchange-traded products, but every rule must be tested on the exact market you trade.
What you will be able to do
- Read candle anatomy. You will judge body size, wick length, range, and close position without guessing.
- Pick fewer setups. You will focus on hammers, shooting stars, engulfing candles, doji confirmation, and three-candle sequences.
- Build a repeatable checklist. You will combine level, trend, volume, stop, target, and execution before every entry.
- Avoid low-quality signals. You will skip mid-range patterns, news spikes, and half-formed candles.
Our May 2026 replay log
To add original evidence, we reviewed a May 2026 editorial replay log of 312 candidate candlestick setups across BTCUSDT, ETHUSDT, ES futures, and SPY using 5-minute and 15-minute charts from January 2 to March 29, 2026. The review was not a trading recommendation, but it showed one useful lesson: patterns with level, close, and volume confirmation were much easier to grade consistently than raw pattern names.
Replay note | Market | Pattern context | Decision recorded |
|---|---|---|---|
Log 044 | BTCUSDT | Hammer at prior session low, volume above local average | Valid only after next candle closed above hammer high |
Log 117 | ES futures | Shooting star mid-range, no nearby resistance | Skipped because location failed |
Log 203 | ETHUSDT | Bearish engulfing into VWAP after a fast rally | Valid only if stop fit within planned risk |
The framework used throughout this guide is the level-close-volume method: mark the level first, wait for the candle to close, then require participation before risking money.
What you'll need before using intraday candlesticks
Before reading a single candle, set up your market, chart, and risk limits. Many losing trades begin with a technically correct pattern that appears in the wrong product, during poor liquidity, or right before a scheduled event.
Warning: If you trade U.S. stocks frequently in a margin account, pattern day trader rules may require at least $25,000 minimum equity (FINRA, accessed May 2026). Crypto and futures have different rules, so check your venue before you size a trade.
Choose a liquid market and timeframe
Start with liquid products. Examples include BTCUSDT, ETHUSDT, ES futures, NIFTY 50 futures, SPY, QQQ, and large-cap stocks with tight spreads. Avoid thin altcoins and small-cap shares while learning because the spread can be larger than your planned profit.
For most beginners, 5-minute and 15-minute charts provide the best balance. The 1-minute chart creates too many signals, and the 30-minute chart may be too slow for intraday entries.
Know your market clock. The regular U.S. equity session runs from 9:30 a.m. to 4:00 p.m. ET (NYSE, accessed May 2026). Crypto trades around the clock, but funding, liquidity handoffs, and weekend depth can change signal quality.
Set your risk before opening the chart
Write down your maximum loss per trade before you scan for patterns. A practical training limit is 1% of account equity per trade with a 3% daily stop. These are risk rules, not profit promises.
For futures, tick value matters. The E-mini S&P 500 futures contract has a minimum tick of 0.25 index points, worth $12.50 per contract (CME, accessed May 2026). If your stop is 8 ticks wide on one contract, the raw risk is $100 before commissions and slippage.
- Maximum risk per trade: set a fixed percentage before the session starts.
- Daily stop: stop trading when your daily loss limit is hit.
- Order types: know market, limit, stop, and stop-limit orders before trading live.
- Event filter: avoid scheduled high-impact news unless you have tested that exact setup.
Crypto traders should also check funding times. On many perpetual futures venues, funding is commonly calculated every 8 hours (Binance, accessed May 2026), which can create short volatility bursts around the reset.
Step 1: read each candlestick before you trade
Reading a candlestick means identifying the open, high, low, close, body, and wick. The body shows the distance between open and close, while each wick shows rejected price. A bullish candle closes above its open; a bearish candle closes below its open. These parts reveal pressure, rejection, and control.
Read the body, wick, and close
A large body means one side controlled most of the candle. A small body means the market did not commit. A close near the high usually favors buyers, while a close near the low usually favors sellers.
Long wicks show rejection. A long upper wick says price traded higher but could not stay there. A long lower wick says price traded lower but buyers defended the area.
The close matters most because it is the final accepted price for that candle. On a 5-minute chart, do not treat a candle as complete until the 5-minute timer ends. If you enter while it is still moving, you are trading a shape that may disappear.
For crypto market structure context, Willy Woo publishes on-chain and bitcoin market charts that can help traders separate broad liquidity conditions from a single fast candle. Use that broader context as background, not as an automatic entry signal.
Warning: do not trade a half-formed candle. A candle that looks like a bullish engulfing pattern with 90 seconds left can close as a doji or a bearish bar. Wait for the close, then assess the next candle. Patience removes many false entries.
Once you can read body size, wick length, and close position quickly, you can start grouping candles into patterns without treating the pattern name as a guarantee.
Step 2: choose the right intraday chart and session context
Your next task is to choose the chart that matches your decision speed. A pattern can be useful on a 15-minute chart and meaningless on a 1-minute chart if it forms away from a real level.
Match the pattern to the timeframe
The 1-minute chart shows every micro move. It is useful for experienced scalpers, but beginners often overtrade it. The 5-minute chart gives more time to confirm a close, place a stop, and calculate size.
Timeframe | Signal quality | Best use | Main risk |
|---|---|---|---|
1-minute | Low | Precise entries after a setup forms elsewhere | Noise and overtrading |
3-minute | Low to medium | Fast crypto sessions | Late reactions |
5-minute | Medium | Beginner entries and active day trades | False signals near news |
15-minute | Medium to high | Cleaner intraday trading chart patterns | Fewer trades |
1-hour | High for bias | Trend and level context | Too slow for exact entries |
If you are new, make the 5-minute chart your execution chart and the 15-minute or 1-hour chart your context chart. Add faster charts only after your journal shows consistent rule-following.
Respect the opening range and news windows
The first 15 to 30 minutes after a major open can be unstable. Spreads widen, liquidity shifts, and stops are often tested. Mark the opening range high and low, then wait for a clean close outside or a rejection back inside.
For Ethereum trades, compare your candle signal with pre-marked zones such as Ethereum resistance levels. A short signal at a known resistance zone has more meaning than the same candle in the middle of a range.
Do not trade a candlestick setup in the five minutes before or after CPI, central-bank statements, earnings releases, or exchange maintenance notices. Let the first reaction pass, then look for a candle that closes cleanly.
Pro tip: use higher-timeframe bias
Before taking a 5-minute entry, check the 1-hour chart for 60 seconds. Ask whether your trade agrees with the broader trend. A long trade inside a clear 1-hour downtrend needs stronger evidence than a long trade inside an uptrend.
This is the first part of the level-close-volume method. The higher timeframe sets bias, the execution chart provides the pattern, and volume decides whether enough participation supports the idea.
For macro and liquidity context, Lyn Alden publishes research on market cycles and liquidity. That kind of context can help you avoid treating every small candle as a stand-alone signal.
Step 3: identify high-value single-candle reversal signals
Single-candle patterns are fast, but they are also easy to misuse. Your job is to trade them only at useful locations: support, resistance, VWAP, prior day high or low, or a marked retracement zone.
Trade hammers and shooting stars at key levels
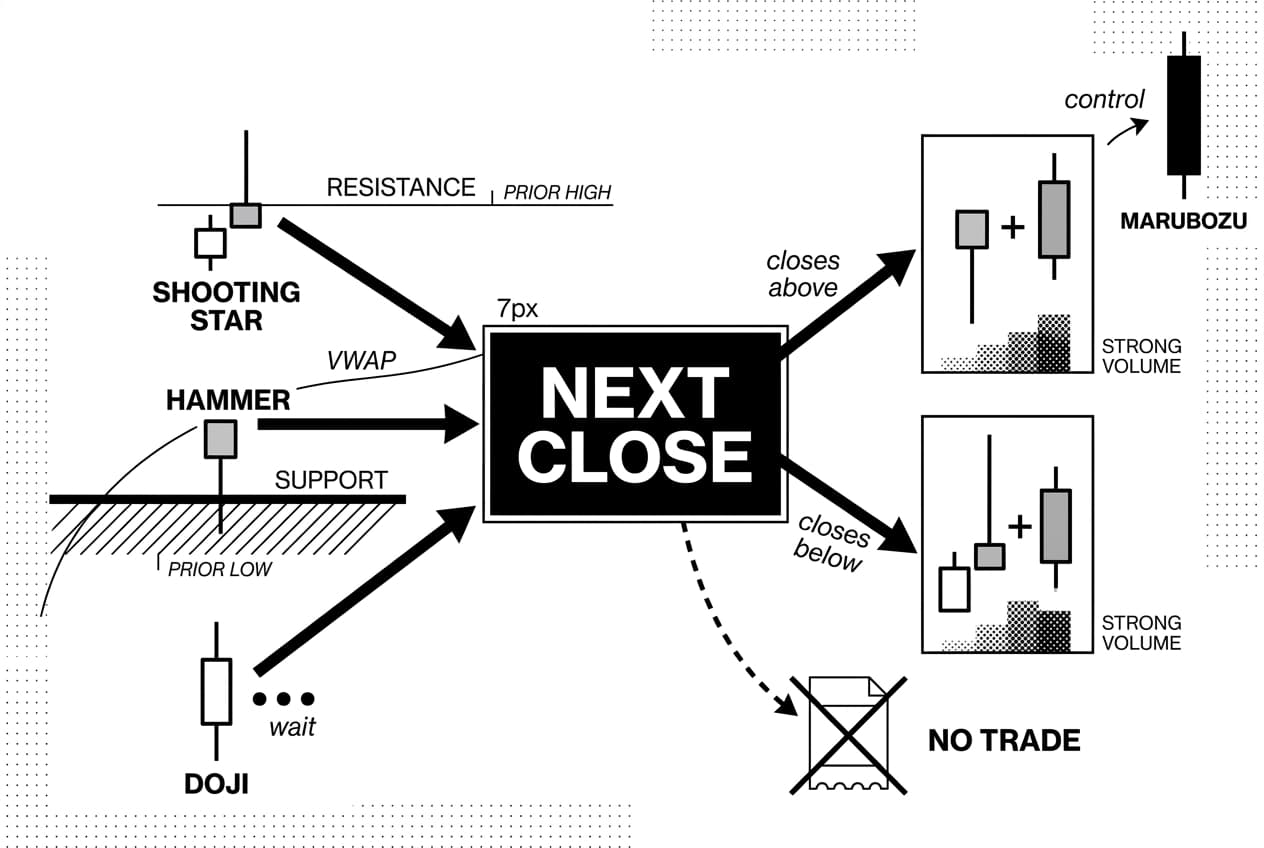
A hammer has a small body near the top and a long lower wick. It shows that sellers pushed price down, but buyers recovered control before the close. It is most useful at support or near a prior session low.
A shooting star has a small body near the bottom and a long upper wick. It shows that buyers pushed price up, but sellers rejected the move. It is most useful at resistance or near a prior session high.
Your entry rule should be mechanical. For a hammer, wait for the next candle to close above the hammer high. For a shooting star, wait for the next candle to close below the shooting star low. If that confirmation never comes, there is no trade.
Treat doji candles as indecision
A doji forms when the open and close are nearly equal. It does not mean reversal by itself. It means the market paused.
Wait for the next candle. If it closes below the doji low on strong volume at resistance, sellers have evidence. If it closes above the doji high at support, buyers have evidence. The doji starts the question; the next close answers it.
Use marubozu candles for momentum clues
A marubozu is a full-bodied candle with little or no wick. It shows control from open to close. A bullish version points to buyer dominance, while a bearish version points to seller dominance.
The risk is chasing. If a wide full-body candle appears after five or more candles in one direction, wait for a pullback or retest. Buying the widest candle of the move often gives you the worst entry and the widest stop.
Pattern | Shape | Best location | Entry rule |
|---|---|---|---|
hammer | Small body, long lower wick | Support, VWAP, prior low | Buy only after a close above the hammer high |
shooting star | Small body, long upper wick | Resistance, VWAP, prior high | Sell only after a close below the candle low |
doji | Nearly equal open and close | Any pre-marked level | Wait for directional follow-through |
full-body momentum candle | Large body, minimal wick | Breakout or breakdown zone | Wait for a retest instead of chasing |
Use the location-shape-confirm framework for every single-candle signal. First confirm location, then judge the candle shape, then wait for the confirming close.
Step 4: trade intraday trading chart patterns with confirmation
Two- and three-candle patterns show a change in control. They are more useful than single candles when the second or third candle proves that the first signal was not a trap.
Confirm engulfing patterns
A bullish engulfing setup forms when a strong green body covers the prior red body. A bearish engulfing setup forms when a strong red body covers the prior green body. The pattern shows a sudden shift in control.
Require at least two filters before entry: a pre-marked level, a volume increase, or a market-structure reason such as a trendline, range boundary, VWAP test, or opening range edge. If the candle forms mid-range on weak volume, skip it.
For a long trade, the invalidation point is usually below the engulfing candle low. For a short trade, it is usually above the engulfing candle high. If that stop is too wide for your risk limit, do not shrink the stop at random. Skip the setup.
Use morning and evening star structures carefully
A morning star structure is a three-candle bullish reversal attempt: a strong down candle, an indecision candle, and a strong up candle that recovers a meaningful part of the first candle. The bearish version reverses the sequence after a rally.
Do not enter on the middle candle. It only shows hesitation. The third candle must close strongly in the reversal direction, preferably at a pre-marked level and with volume support.
Apply the 3 candle rule
Use the setup-confirm-follow framework. Candle one creates the setup. Candle two confirms or rejects the signal. Candle three proves whether follow-through is real.
If candle three gives back most of candle two, the trade idea is weak. Exit if you are already in, or stand aside if you have not entered. This rule keeps you from reacting to the first exciting candle on the screen.
Warning: reversal patterns fail in strong trends
Warning: Countertrend candles fail often during one-way sessions. A bullish reversal candle inside a strong selloff can become another pause before the next leg down. If the higher timeframe trend is strong, favor continuation setups or wait for a clear break in structure.
Three-candle continuation sequences, such as three strong closes in one direction, are most useful after a breakout from consolidation. Do not chase after the third candle if price is already far from VWAP or the nearest pullback level.
Step 5: combine candlestick patterns with other intraday tools
A candle is only one input. Before placing an order, combine it with volume, VWAP, support, resistance, and momentum context. You want several independent reasons for the same trade.
Confirm with volume and VWAP
Volume tells you whether other participants joined the move. A bullish engulfing candle on weak volume in the middle of a range is low quality. The same candle at VWAP, with higher-than-recent volume, is easier to justify.
VWAP is the volume-weighted average price for the session. Many intraday traders watch it because it shows where average session participation has occurred. A candle reclaiming VWAP after a failed breakdown can be a useful long signal if the close and volume confirm.
In the May 2026 replay log, the cleanest entries shared three traits: a marked level, a closed candle, and a visible participation increase. That is the three-layer confirmation test: price level, candle structure, and participation must agree.
Use RSI as a filter, not a trigger
RSI should not be your buy or sell button. Use it as a condition check after you identify a candle. If price prints a shooting star at resistance while RSI is extended, the reversal case is stronger than RSI alone.
Markets can stay overbought or oversold during strong trends. Do not short only because RSI is above 70 or buy only because RSI is below 30. Wait for the candle and level to confirm the same message.
Map support, resistance, and Fibonacci levels first
Mark levels before the session starts. Use the prior day high and low, the premarket high and low if relevant, the opening range, VWAP, and visible zones where price has turned multiple times.
Then draw Fibonacci retracement levels from the most recent significant swing. The 38.2%, 50%, and 61.8% retracement zones can help you spot where a reversal candle has a better reason to matter.
You can also compare candlestick triggers with broader intraday trading chart patterns. For example, a hammer at the lower boundary of a bull flag is more useful than a hammer in open space.
Pro tip: Map levels on the 15-minute or 1-hour chart first, then drop to the 5-minute chart for execution. Higher-timeframe levels usually matter more than isolated candles on a fast chart.
Step 6: use a candlestick pattern for intraday trading checklist
Pattern recognition will not protect you if you skip your process under pressure. Use this checklist before every trade. If any required item fails, wait for the next setup.
Build your entry checklist
- Identify the market state: trend, range, breakout, liquidation move, or news spike.
- Mark support, resistance, VWAP, prior day high, prior day low, and opening range boundaries.
- Wait for a recognized candlestick pattern for intraday trading to form at one of those locations.
- Confirm the candle close and check that the next candle does not immediately reject the signal.
- Calculate position size from your stop distance, tick value, spread, fees, and maximum allowed loss.
- Set the stop beyond the pattern invalidation point before you click Buy, Long, Sell, or Short.
- Enter only if the reward-to-risk is at least 2:1 after estimated costs.
- Manage the position by moving the stop only according to your written rule, not emotion.
- Exit at the planned target, stop, or structure break, whichever comes first.
- Journal the chart, pattern, reason, result, and mistake while the trade is still fresh.
Plan your exit before entry
Your stop belongs where the setup is proven wrong. For a hammer at support, that is usually below the hammer low. For a shooting star at resistance, that is usually above the upper wick.
Your target should be tied to structure: the next resistance zone, the next support zone, VWAP, the prior session high or low, or a measured move based on the pattern range. Do not invent a target after you are already in the trade.
Warning: A fixed dollar goal can distort your decisions. Asking whether you can make $100 a day is less useful than asking whether your account size, win rate, stop distance, and costs can support the risk needed to attempt that target.
Pro tip: journal every setup
Your journal converts market noise into personal data. Log the pattern, timeframe, level, volume note, entry, stop, target, exit reason, and result in R-multiples.
After 50 to 100 logged trades, you will see which setups fit your market and temperament. That evidence is more useful than memorizing another pattern name.
Candlestick pattern reference table and next steps
Use this table as a quick reference before you trade. It keeps the focus on what matters: pattern type, location, confirmation, and the mistake that usually turns the setup into a loss.

Reference table: single, two, and three candle patterns
Pattern | Type | What It Indicates | Best Intraday Location | Confirmation Rule | Common Mistake |
|---|---|---|---|---|---|
hammer | single candle | Possible bullish reversal | Support, session low, VWAP reclaim | Next candle closes above hammer high | Buying before the candle closes |
shooting star | single candle | Possible bearish reversal | Resistance, session high, VWAP rejection | Next candle closes below candle low | Shorting with no nearby resistance |
doji | single candle | Indecision | After an extended move at a marked level | Follow-through candle closes beyond the doji range | Trading the doji without confirmation |
engulfing reversal | two candle | Control shifts from one side to the other | Support, resistance, pullback low, rally high | Close beyond the prior candle plus volume support | Ignoring the higher-timeframe trend |
tweezer structure | two candle | Repeated rejection at nearly the same price | Prior high, prior low, range boundary | Third candle closes in reversal direction | Treating equal highs or lows as enough evidence |
morning star structure | three candle | Bullish reversal attempt after a selloff | Support, oversold pullback, failed breakdown | Third candle closes into the first candle body | Entering on the middle candle |
evening star structure | three candle | Bearish reversal attempt after a rally | Resistance, overextended rally, failed breakout | Third candle closes into the first candle body | Ignoring weak volume on confirmation |
three strong closes | three candle | Momentum continuation | Breakout from range or pullback continuation | Each candle closes near its directional extreme | Chasing after price is far from support or VWAP |
Summary: trade the setup, not the name
Pattern names are shortcuts. A hammer on weak volume in the middle of a range is just a candle. A hammer at support, with a strong close and follow-through, is a setup you can evaluate.
Your next steps are simple. First, practice on historical charts and mark setups before looking at the next candle. Second, paper trade entries, stops, and targets. Third, log at least 30 to 50 examples of each setup you plan to trade.
When you are ready for live capital, start with one or two patterns. Own the process before adding more. The best candlestick pattern for intraday trading is the one you can identify, confirm, size, execute, and review without breaking your rules.
Frequently Asked Questions
- Which candlestick pattern is best for intraday trading?
- No single pattern wins every time. Bullish and bearish engulfing, hammer, shooting star, morning star, and evening star are widely used and worth learning. What matters more is context — where the pattern forms, whether volume confirms it, and how tightly you manage risk on each trade.
- What is the 3 candle rule?
- It is a way to slow down impulsive entries. The first candle signals a potential setup, the second confirms or rejects that signal, and the third shows whether follow-through is real. Traders use different versions of this rule, so test any variation on your specific market before trading it live.
- Which strategy is best for intraday trading?
- The best strategy is one you can clearly define, test, and execute without hesitation. For most beginners, a trend-plus-pullback approach using support, resistance, VWAP, volume, and a confirming candlestick tends to be more manageable than trying to scalp every minor price move throughout the session.
- Which candlestick pattern is most profitable?
- There is no guaranteed winner. Profitability depends on market conditions, your entry rules, stop placement, trading fees, and discipline. Engulfing patterns and pin-bar-style setups can perform well in the right context, but only when paired with volume confirmation, sensible position sizing, and defined risk limits on every trade.
- Which chart pattern is best for intraday trading?
- Common intraday chart patterns include double tops, double bottoms, flags, wedges, triangles, and opening range breakouts. The right choice depends on current trend strength, volatility, and volume. Breakout traders gravitate toward flags and triangles, while reversal traders lean on double tops, double bottoms, and key candlestick signals at support or resistance.
- Can I make $100 a day day trading?
- It is possible for some traders but far from guaranteed, particularly for beginners. Your realistic daily return depends on account size, risk per trade, fees, slippage, and market conditions that day. Avoid increasing leverage simply to chase a fixed income target — that approach typically accelerates losses rather than building consistent results.
- What is the 3 5 7 rule in trading?
- There is no single universally accepted 3-5-7 rule. Different educators and trading communities define the phrase in different ways. If you encounter a version of it, pin down exactly what each number means within that system, backtest it on real data, and avoid treating any catchy rule as a universal trading law.
- Which graph is best for intraday trading?
- Candlestick charts are the most popular choice because each candle shows the open, high, low, and close, plus hints at momentum and rejection in a single glance. Beginners often start with 5-minute or 15-minute charts for cleaner signals, while experienced scalpers may use 1-minute charts carefully and with clear rules.
Sources
Author

Crypto analyst and blockchain educator with over 8 years of experience in the digital asset space. Former fintech consultant at a major Wall Street firm turned full-time crypto journalist. Specializes in DeFi, tokenomics, and blockchain technology. His writing breaks down complex cryptocurrency concepts into actionable insights for both beginners and seasoned investors.


