Double Bottom Chart Pattern: Bullish Reversal Setup Guide

Double bottom chart pattern: bullish reversal setup guide
What is a double bottom chart pattern?
A double bottom chart pattern is a bullish reversal setup formed when price makes two lows near the same support area, bounces to a neckline between them, and then breaks above that neckline, suggesting sellers may be losing control after a downtrend.
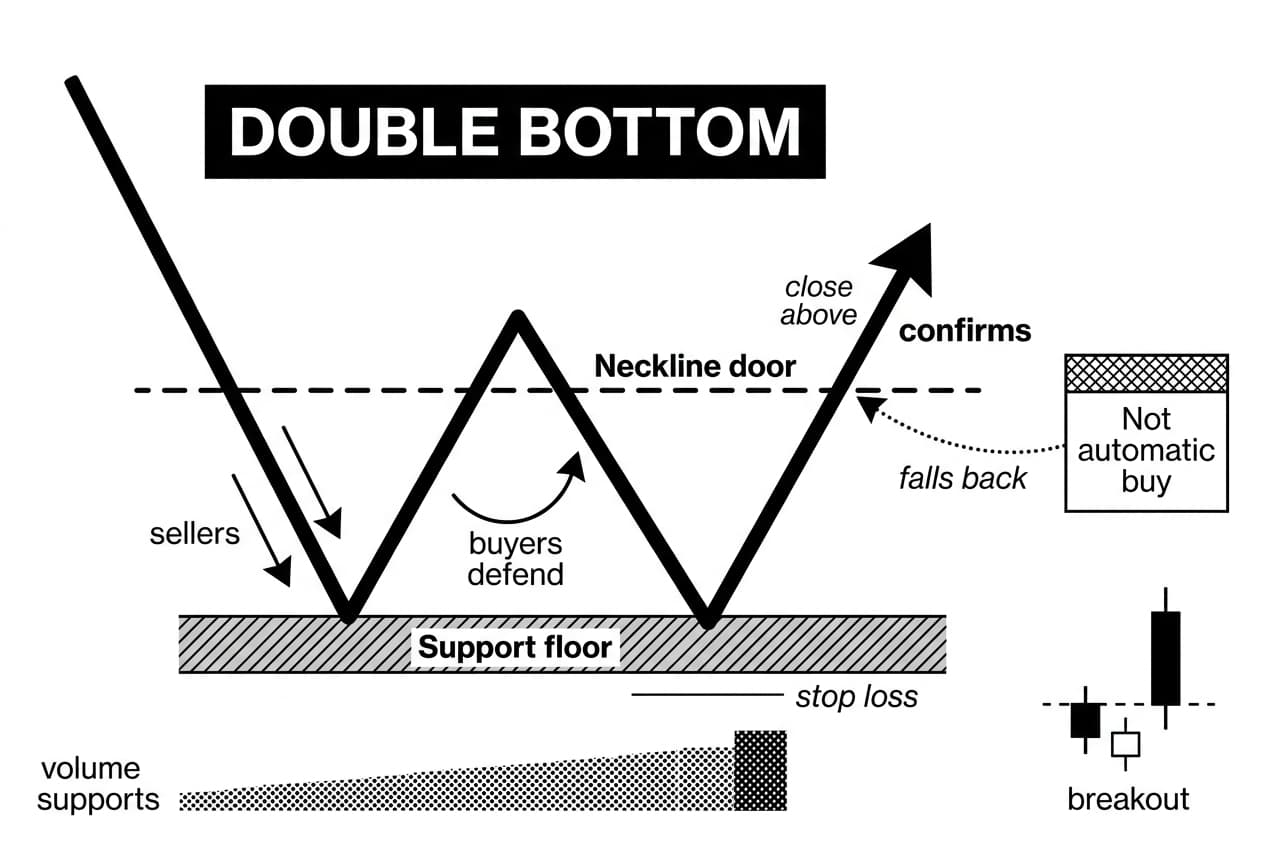
Why it matters: beginners often see a W-shape and assume it is an automatic buy signal. That is risky, especially in crypto. A better approach is to treat the pattern as a conditional setup. The trade idea becomes stronger only when price confirms above resistance, volume supports the move, and your stop loss is clear before entry.
A practical analogy: support is the floor, the neckline is the door, and the breakout is price actually leaving the room. If price only taps the door and falls back, the reversal has not proved itself.
The basic structure is simple. The market first falls, then buyers defend a low. Price rebounds to a reaction high, which becomes the neckline, meaning the resistance level between the two lows. Price then returns to the same support zone. The pattern is confirmed only after a close above the neckline. This two-low structure and neckline requirement are also how beginner education sources describe the pattern (Investopedia, 2024).
For crypto context, Willy Woo, an on-chain analyst, publishes market-cycle and volume tools that help traders compare price structure with participation. Lyn Alden, founder of an investment research firm, is useful for the macro side of the same question because liquidity conditions can overpower clean-looking chart setups.
The basic W-shape explained
- first low: price falls into support and buyers push back.
- middle rebound: price rallies to a local high. That high becomes the neckline.
- second low: price retests the same support area. It can be slightly above or below the first low.
- confirmed breakout: price closes above the neckline, ideally with higher volume.
One dated reference case is bitcoin in early 2023. BTC traded near $16,500 at the start of January and then moved above $21,000 by mid-month (CoinGecko, 2023-01). The value for beginners is not that every chart will copy that move. The lesson is that a support retest became more useful after the market reclaimed the resistance area above it.
Brief background
Double bottoms come from classical chart analysis, a branch of technical analysis that studies price and volume behavior. The idea predates crypto by decades, but the logic still applies: if sellers push price down twice and fail to create a fresh breakdown, the balance between supply and demand may be changing. Crypto adds speed, weekend trading, and thinner liquidity, so confirmation matters even more.
Why the pattern matters for crypto and stock traders
The double bottom chart pattern matters because it gives traders a repeatable way to separate a possible bottom from a confirmed reversal attempt. That distinction protects beginners from buying too early. Instead of guessing where the lowest price will be, you wait for evidence that buyers can take price back above the neckline.
In stocks, trading sessions open and close. In crypto, major assets trade 24 hours a day, 7 days a week (Coinbase, 2024). That constant trading window creates more overnight wicks, weekend squeezes, and false moves. A W-shape that looks clean on a screenshot may still be a trap if the breakout happens on weak participation.
This guide uses a simple original framework called the neckline-first reversal filter. The rule is: do not grade a double bottom by shape first. Grade it by sequence. You want a prior downtrend, defended support, a visible neckline, a close above that neckline, and a defined invalidation level. If one part is missing, the trade is not ready.
Anatomy of a valid double bottom setup
A valid setup starts with a clear downtrend. A downtrend means price is making lower highs and lower lows. Without that prior decline, there is no reversal to identify.
The two lows should appear near the same support zone. A support zone is an area where buyers have previously stepped in. The two lows do not need to be identical. On daily crypto charts, a second low that slightly undercuts the first can still qualify if price quickly recovers and does not close far below support.
The neckline is the reaction high between the lows. While price is below it, the neckline acts as resistance. After a breakout, that same level may turn into support. This is called a support-resistance flip. If you want more practice with that concept, our guide to Ethereum resistance levels explains how repeated tests can turn a price area into a decision zone.
Volume is the next quality check. Volume means the amount traded during a candle or period. A breakout with rising volume shows broader participation. A breakout with thin volume says the move may be driven by short-term liquidity rather than committed buyers.
Must the two bottoms be the same price?
No. The two lows should be close enough to show that buyers are defending the same area, but they rarely match to the cent. A rough guide is that the lows should stay within the normal volatility range of the asset and timeframe you are trading. For large liquid coins, a smaller gap may matter. For smaller altcoins, a wider gap can still be normal.
What matters more is the close. If the second low wicks below the first low but closes back above support, buyers may have absorbed selling pressure. If price closes well below the first low and cannot recover, the pattern has failed.
Neckline, support, and resistance
Resistance is a price area where sellers have previously stopped a rally. The neckline is the resistance line created by the bounce between the two bottoms. A double bottom does not become bullish just because support held twice. It becomes actionable when price closes above that neckline.
Pair this with basic trendline trading skills so you do not draw the neckline through random candle noise. Use candle closes, repeated reaction points, and the same timeframe from start to finish.
The rules: how to identify the pattern step by step
Use the same process every time. Consistency is what turns chart reading from guesswork into a decision checklist.
- prior downtrend: the asset must already be falling. For example, a token moves from $2.00 to $1.20 over several weeks.
- first bottom: price hits support and bounces. In the example, buyers appear near $1.20.
- bounce to neckline: price rallies to an intermediate resistance area, such as $1.50. That level becomes the neckline.
- second bottom: price pulls back toward support again, perhaps to $1.18 or $1.22. The test should be near the same support zone.
- breakout confirmation: price closes above the $1.50 neckline. A wick above the line is not enough. You want a candle close on the timeframe you are trading.
Step-by-step checklist
- Is there a real downtrend before the first low?
- Are the two lows near the same support zone?
- Is the middle bounce high easy to identify as a neckline?
- Did price close above the neckline rather than only spike through it?
- Does volume, momentum, or broader market context support the move?
If the answer to any of those questions is no, wait. Missing a trade is less damaging than entering a pattern before it confirms.
Timeframe considerations
A double bottom on a 5-minute chart is much noisier than one on a daily chart. Short timeframes react to single orders, funding-rate shifts, and liquidation cascades. Daily and weekly patterns carry more weight because they reflect more decisions over more time.
For beginners, the 4-hour chart is often the lowest practical timeframe for crypto pattern work. Daily charts are cleaner. Higher-timeframe signals also pair better with macro research from analysts such as Lyn Alden, because broad liquidity conditions can decide whether risk assets are supported or under pressure.
Confirmation: when a double bottom becomes bullish
Seeing two lows is not enough. The double bottom chart pattern becomes bullish only when price closes above the neckline. Confirmation means the market has not only defended support but also reclaimed the resistance level that capped the first bounce.
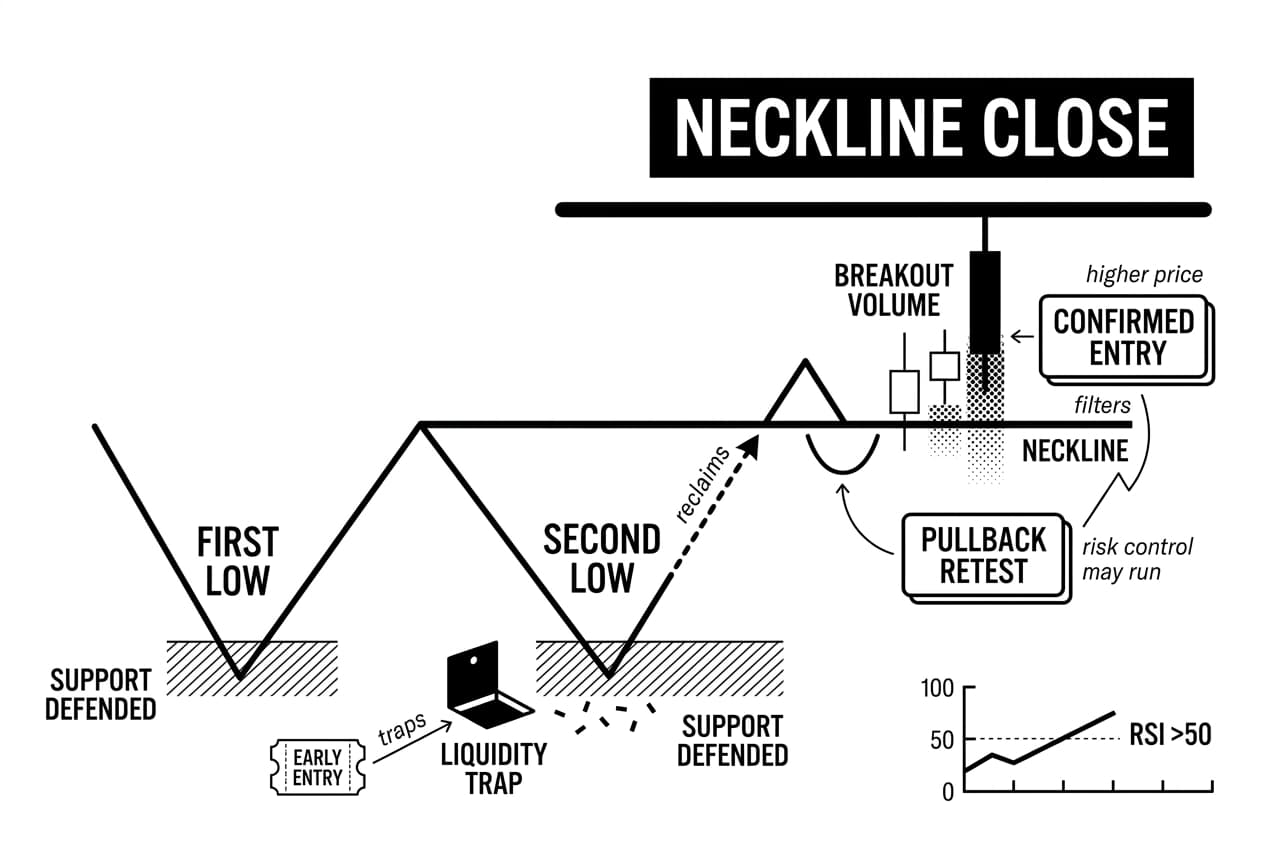
The contrarian point is important: an unconfirmed second low can be a liquidity trap. Buyers enter early, stops collect below the lows, and price continues lower. A confirmed neckline reclaim helps filter out many of those weak setups.
Neckline breakout vs. early entry
There are three common entry styles. None is perfect. The right choice depends on your skill level and risk tolerance.
entry style | when it happens | main benefit | main risk |
|---|---|---|---|
aggressive | near the second bottom | best price if the reversal works | pattern is not confirmed |
confirmed | after a close above the neckline | clearer signal | entry price is higher |
pullback | after price retests the neckline as support | best mix of confirmation and risk control | trade may run without you |
For most beginners, the confirmed or pullback entry is safer than trying to buy the exact second low. You will miss some trades, but you will also avoid many false reversals.
Volume and momentum clues
- rising breakout volume: more trading activity on the breakout suggests wider buyer participation.
- RSI recovery: the relative strength index, or RSI, is a momentum tool measured on a 0 to 100 scale (Investopedia, 2024). A move above 50 often signals improving momentum.
- weaker selling on the second low: lower sell-side volume at the second bottom can show that sellers are tiring.
Willy Woo is a useful reference for this part of the process because on-chain and volume-based tools can show whether a move is backed by broad participation or only short-term price noise.
Price targets, stop losses, and risk management
Once the pattern confirms, the practical questions are simple: where is the target, where is the stop, and how much can you afford to lose if the setup fails?
Does the double bottom suggest a price target?
Yes, but it suggests a target rather than promises one. The classic method is the measured move. Measure the distance from support to the neckline, then add that distance to the breakout level. If support is $100 and the neckline is $120, the pattern height is $20. Add $20 to the neckline, and the target becomes $140.
That target is a planning tool. It is not a prediction. If market conditions weaken, the trade can fail before reaching the measured move.
Where traders often place stop losses
A stop loss is a pre-set exit level used to limit damage if price moves against you. For double bottoms, common stop areas include below the second bottom, below the support zone, or below a neckline retest after a pullback entry.
The stop should be chosen before entry. If you move the stop lower because you do not want to take the loss, you are no longer following the trade plan.
Simple risk/reward example
Assume the neckline is $120, the stop is $115, and the target is $135. You are risking $5 to seek $15, which is a 1:3 risk/reward ratio. If you are willing to risk $50 total, you can buy 10 units because $50 divided by $5 risk per unit equals 10 units.
component | meaning | example |
|---|---|---|
support | price area where buying stopped the decline | $100 |
neckline | resistance level between the two bottoms | $120 |
pattern height | distance from support to neckline | $20 |
target | neckline plus pattern height | $140 |
stop loss | exit level if the setup fails | $115 |
risk/reward | possible loss compared with possible gain | $5 risk and $15 reward, or 1:3 |
Real-world example: a double bottom in action
Here is a clean teaching example using a sample crypto token called XPL. The token falls from $1.00 to $0.60, then bounces to $0.75. That $0.75 high becomes the neckline. Price then returns to $0.58, slightly below the first low, but closes back above support.
A cautious trader still waits. The signal appears only when a daily candle closes above $0.75 with better volume than the recent average. If price touches $0.76 during the day and closes at $0.70, there is no confirmed breakout.
How the trade plan could look
plan item | level | reason |
|---|---|---|
entry | $0.76 | entered after a daily close above the $0.75 neckline |
stop loss | $0.70 | below the breakout area for a confirmed-entry plan |
target | $0.90 | $0.75 neckline plus $0.15 pattern height |
full invalidation | close below $0.58 | price has lost the second bottom |
risk/reward | about 1:2.3 | risk is $0.06 and planned reward is $0.14 |
This example shows why the stop matters. The chart can still fail after a breakout. A prepared trader knows the exit before the entry.
Combining double bottoms with other indicators
A double bottom chart pattern is stronger when independent tools support it. Independent means the tools measure different things. Price structure, volume, momentum, and market context should not all come from the same signal.
RSI divergence
Bullish divergence happens when price makes an equal or lower second low while RSI makes a higher low. That means downside momentum is fading even though price is still testing support. Beginners can spot this by comparing the two price lows with the two RSI lows under the chart.
Moving averages can also help. A breakout that reclaims the 50-day or 200-day moving average has more support than a breakout that remains below both. Fibonacci retracement levels can also show whether the neckline sits near a prior retracement area. For charting tools that make these checks easier, see our guide to the best TradingView indicators for crypto.
Fundamentals and market context
Chart patterns do not exist in isolation. A double bottom on a token facing a major open up, exchange delisting, or security issue is weaker than the same pattern on an asset with neutral news and improving market liquidity.
- token unlocks: new supply can pressure price.
- regulatory news: enforcement actions or policy changes can override chart signals.
- exchange listings: listings can increase demand, while delistings can break support fast.
- bitcoin trend: many altcoins struggle to reverse when bitcoin is falling.
- macro events: rate decisions and inflation data can shift risk appetite.
Keep a crypto economic calendar open when reviewing setups. Lyn Alden is a useful approved reference for this macro layer because her public research focuses on liquidity, currency cycles, and risk assets.
Common mistakes and false signals to avoid
The most common mistake is calling the pattern too early. Two lows near the same area are not enough. Without a close above the neckline, you are trading a shape rather than a confirmed setup.
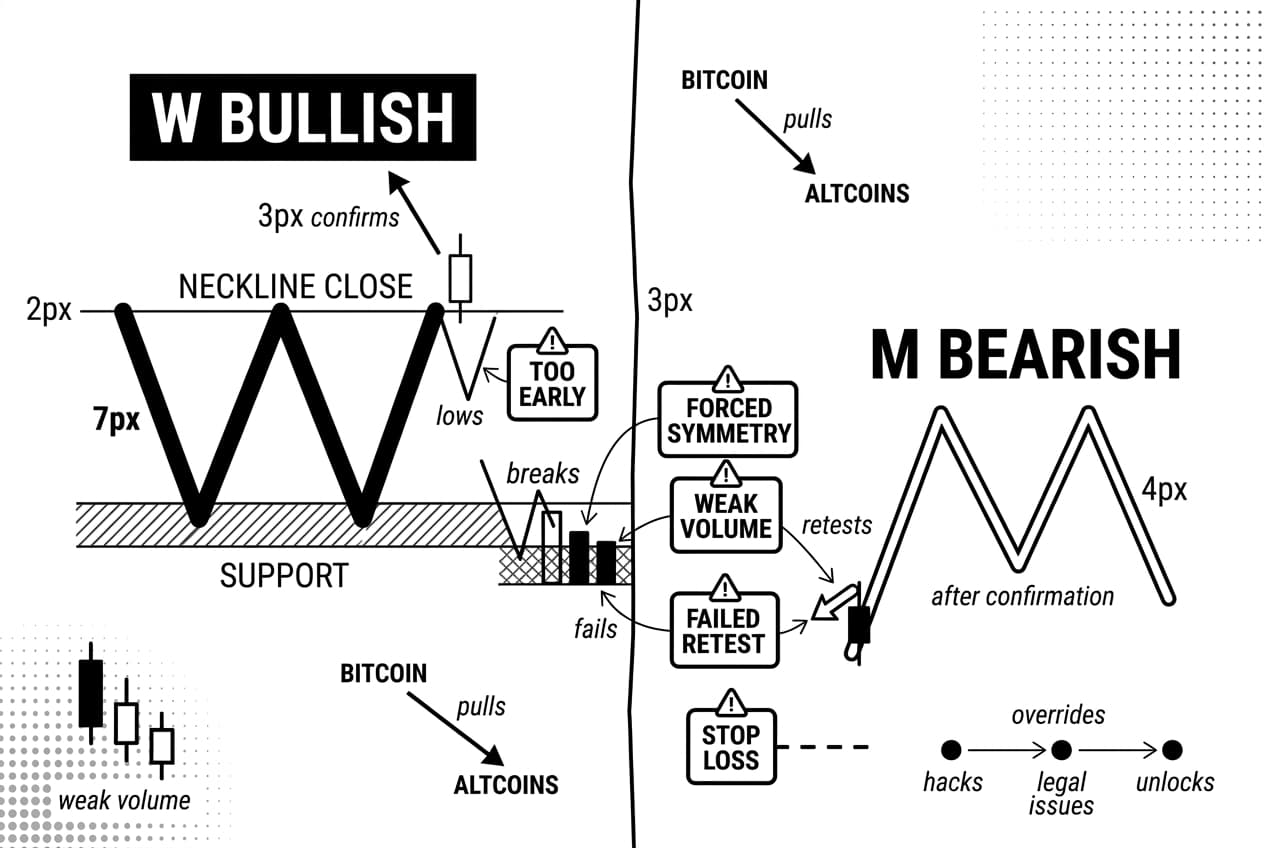
The second mistake is forcing symmetry. The lows do not need to match exactly. A support zone is more realistic than a single perfect line, especially in crypto.
The third mistake is ignoring volume. If price breaks the neckline on weak volume, buyers may not have enough strength to keep the move alive. A failed neckline retest is another warning. If price breaks out, retests the neckline, and then closes below it, the setup has weakened or failed.
The fourth mistake is skipping the stop loss. Every pattern fails sometimes. A stop below the planned invalidation area keeps one failed chart from becoming a major account problem.
Double bottom vs. double top
A double bottom forms after a downtrend and points to a possible move higher. A double top is the opposite. It forms after an uptrend and points to a possible move lower. The visual memory aid is simple: W is usually bullish after confirmation, while M is usually bearish after confirmation.
When the pattern is not enough
- no prior downtrend: a sideways market is not a reversal setup.
- weak breakout volume: the move may lack participation.
- bad market context: a falling bitcoin market can pull altcoins down.
- negative project news: hacks, legal issues, and unlocks can override charts.
- failed neckline retest: losing the neckline after breakout is a warning to exit or reduce risk.
The double bottom is best treated as a conditional green light. It becomes useful when structure, confirmation, risk management, and context all point in the same direction.
Frequently Asked Questions
- Is the double bottom pattern bullish?
- A double bottom is considered a bullish reversal pattern, but only after confirmation. That confirmation comes when price breaks above the neckline, ideally with a candle close. Before that breakout occurs, it remains a developing setup rather than a confirmed bullish signal worth trading.
- What is the most profitable chart pattern?
- No single chart pattern is universally the most profitable. Results depend heavily on market conditions, timeframe, confirmation rules, and how well you manage risk. Double bottoms can offer solid setups, but without proper stops and position sizing, even reliable patterns will produce inconsistent outcomes over time.
- What is the rule of double bottom?
- Price must first be in a downtrend, then form two lows near the same support level with a bounce between them creating a neckline. The pattern confirms when price breaks above that neckline. A common price target is measured by adding the pattern's height to the breakout point.
- Is the "W" pattern bullish or bearish?
- The W pattern is generally bullish because it visually mirrors a double bottom formation. Its counterpart, the M pattern, represents a double top and carries a bearish bias. That said, a W shape still requires a neckline breakout before most traders treat it as a confirmed bullish opportunity.
Sources
Author

Crypto analyst and blockchain educator with over 8 years of experience in the digital asset space. Former fintech consultant at a major Wall Street firm turned full-time crypto journalist. Specializes in DeFi, tokenomics, and blockchain technology. His writing breaks down complex cryptocurrency concepts into actionable insights for both beginners and seasoned investors.


