Trendline Trading: A Guide to Drawing & Trading Trend Lines

What is Trendline Trading? (And Why It Matters)
Trendline trading is a technical analysis method where traders draw lines on a chart to connect a series of prices. These lines help identify the market's direction, visualize potential support and resistance zones, and generate buy or sell signals when the price interacts with the trendline, forming a foundational trading strategy.
Think of trendlines as the guardrails of the market. Price charts can look chaotic, but these simple lines bring clarity to the price action. By connecting the dots—either the highs in a downtrend or the lows in an uptrend—you create a visual boundary that shows you the dominant direction of the market's momentum.
So, why does this matter for you? Because effective trendline trading helps you make better decisions. It provides clear potential entry and exit points, helping you manage risk and identify when a trend might be strengthening, weakening, or reversing. It's one of the most fundamental yet powerful tools you can learn.
The Core Principles of Technical Analysis for Trendlines
Before you can draw a single line on a chart, you need to understand the language the market is speaking. Trendlines are visual tools, but they represent powerful underlying market dynamics. Grasping these core concepts is what separates guesswork from effective trendline trading.
Understanding Market Direction: Trends
At its heart, the market can only move in three directions. An uptrend is characterized by a series of higher highs and higher lows, showing that buyers are in control. A downtrend shows the opposite, with lower lows and lower highs, indicating sellers have the upper hand. The third direction is a sideways or ranging market, where the price bounces between two levels without a clear direction.
The Battlegrounds: Support and Resistance
Think of support and resistance as invisible floors and ceilings for price. Support is a price level where buying interest is strong enough to prevent the price from falling further. Resistance is a level where selling pressure is strong enough to stop the price from rising higher. A well-drawn trendline will act as a dynamic form of support in an uptrend or resistance in a downtrend.
Reading the Story: Price Action
Price action is simply the movement of price on a chart. Instead of relying on complex indicators that lag behind the market, analyzing price action means you're making decisions based on what is happening right now. Trendline trading is a pure form of price action analysis, allowing you to interpret the market's story directly from the chart itself.
Types of Trendlines: Uptrend vs. Downtrend
Now that you understand the basic principles, let's look at the two fundamental types of trendlines you will encounter. All successful trendline trading strategies boil down to identifying and acting on one of these two patterns. Think of them as the foundation for reading any price chart.
The Uptrend Line (Support)
When a market is in an uptrend, prices make a series of higher highs and, more importantly, higher lows. You draw an uptrend line by connecting at least two of these higher lows. This line then acts as a dynamic floor, or support, underneath the price. As the price comes down to touch the line, buyers often step in, pushing it back up.
On a chart, you would see this line angled upwards, running below the price action and "catching" the bottom of each pullback.
The Downtrend Line (Resistance)
Conversely, a market in a downtrend creates a pattern of lower lows and lower highs. To draw a downtrend line, you connect two or more of these lower highs. This line acts as a ceiling, or resistance, above the price. When the price rallies to meet the trendline, sellers tend to take control and push it back down.
Picture this line angled downwards on your chart, sitting above the price action and connecting the peak of each rally.
How to Draw Trend Lines Accurately: A Step-by-Step Guide
Now that you understand the theory, it's time to put it into practice. This is where the rubber meets the road in trendline trading. Drawing accurate trendlines is a skill, but it's one you can master by following a clear process. Precision is everything, as a slightly misplaced line can lead to a completely different trading decision. Let’s walk through it together.
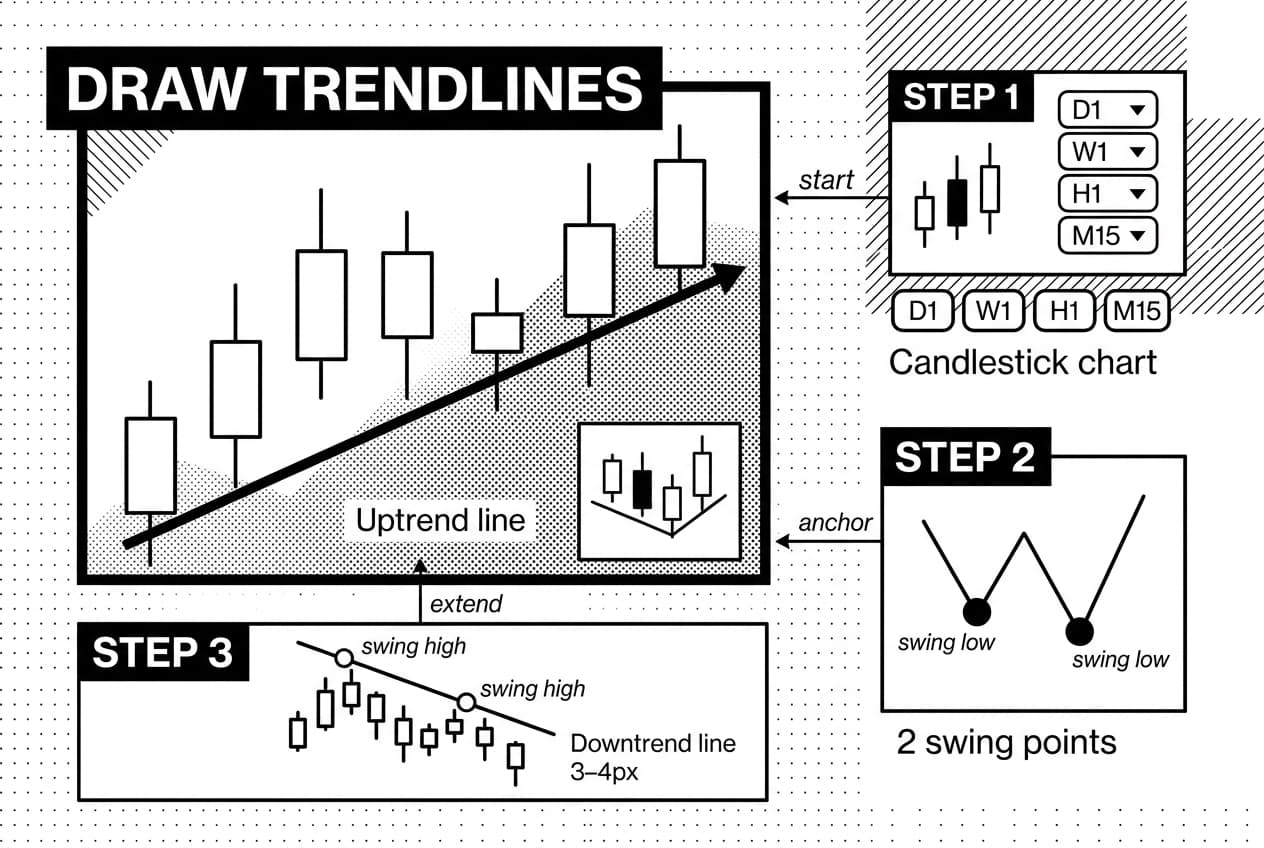
Step 1: Choose Your Chart and Timeframe
Before you draw anything, you need a clean workspace. Start with a candlestick chart, as it provides the most detailed price information. Next, select your timeframe based on your trading style. If you're analyzing a trend over several months, the daily (D1) or weekly (W1) charts are your best tools. For short-term or day trading, the hourly (H1) or 15-minute (M15) charts will be more relevant.
It's important to understand that a single stock or currency pair can have different trends on different timeframes simultaneously. Always start with a higher timeframe to understand the major trend before zooming in.Step 2: Identify at Least Two Major Swing Points
To draw any line, you need at least two points. For trendlines, these points are significant swing highs or swing lows. A swing high is a clear peak in price before it pulls back. A swing low is a distinct valley where price bottomed out before rallying.
To draw an uptrend line, you will look for two clear, consecutive swing lows. To draw a downtrend line, you'll need two clear, consecutive swing highs. Look for obvious turning points, not the minor fluctuations in between.Step 3: Connect the Points and Extend the Line
Select the trendline tool on your charting platform. For an uptrend, click on your first swing low and drag the line to connect to the second swing low. A common debate is whether to connect the candle bodies or the wicks. For maximum accuracy, I recommend connecting the absolute price extremes—the very tips of the wicks. The key is to be consistent with your method.
Don't just stop the line at your second point. Extend it out to the right, into the "future" area of the chart. This projected line is what you'll use to anticipate where price might find support or resistance later on.Step 4: Validate with a Third Touchpoint
A line connecting two points is speculative. It’s just a potential trend. The trendline becomes truly significant and actionable when the price confirms it with a third touch. After you've drawn your initial two-point line, watch and wait. If price moves back to your line, touches it, and then "respects" it by bouncing off, your trendline is now validated.
This third touch provides powerful confirmation that other traders are seeing and reacting to the same line. A validated, three-point trendline gives you much more confidence to base your trades on.
Common Trendline Trading Strategies for 2026
Now that you can draw trendlines with confidence, it's time to put them to work. Drawing the line is just the first step; the real skill in trendline trading comes from knowing how and when to act. Let's walk through the two most popular strategies you can start using today.
Strategy 1: The Trendline Bounce (Trend Following)
This is the classic "buy the dip" or "sell the rally" approach. The idea is to trade in the same direction as the prevailing trend. You're assuming that the trendline will continue to act as support (in an uptrend) or resistance (in a downtrend) and that the price will "bounce" off it.
Here’s how you can approach it in an uptrend:
- Entry: Wait for the price to pull back and touch your confirmed uptrend line. Enter a long (buy) position once you see a bullish candlestick pattern form right off the line, confirming the bounce. Don't just buy the instant it touches!
- Stop-Loss: Place your stop-loss order just below the trendline. If the price breaks through decisively, your trade idea is no longer valid.
- Take-Profit: Set your profit target near the previous swing high in the uptrend. This offers a clear and logical exit point.
Strategy 2: The Trendline Break (Trend Reversal)
No trend lasts forever. This strategy helps you identify and trade a potential reversal. The goal is to enter a trade when the price breaks through a well-established trendline, signaling that the old trend is losing steam and a new one may be starting.
Let's look at a break of an uptrend:
- Entry: Wait for a strong candlestick to close below the uptrend line. A weak poke doesn't count. Some traders wait for a "retest," where the price comes back up to touch the broken trendline from below before entering a short (sell) position.
- Stop-Loss: Place your stop-loss just above the broken trendline. If the price moves back above it, the breakout was false.
- Take-Profit: Your initial target could be the most recent swing low. As the new downtrend develops, you can adjust your targets accordingly.
These two foundational methods are cornerstones of trendline trading. Once you master them, you can explore advanced trading strategies that combine trendlines with other indicators.
Common Mistakes to Avoid in Trendline Trading
Drawing lines on a chart seems simple, but a few common mistakes can derail your strategy before it even starts. By being aware of these pitfalls, you can approach your analysis with more confidence and precision.
- Forcing a trendline: If you have to connect non-obvious points or cut through multiple candle bodies, a valid trend probably doesn't exist. The best trendlines are clear and connect distinct swing highs or lows. Don't invent a trend where there isn't one.
- Ignoring a trendline break:
A trendline is a guide, not a permanent barrier. When price decisively breaks through your line, it's a significant signal. Treating this as a potential trend change is an essential part of effective managing risk in a downturn.
- Relying on one indicator: Your trendline is a powerful tool, but it shouldn't be your only one. Successful trendline trading involves seeking confirmation from other sources, like trading volume or momentum indicators, to validate your entry or exit signals.
Limitations and Best Practices
As you've seen, trendlines are a fantastic tool, but it's important to understand their limitations. No technical tool is foolproof, and trendlines are no exception. One of their biggest challenges is subjectivity; two different traders might draw the same trendline slightly differently, leading to different conclusions. This is a normal part of the process.
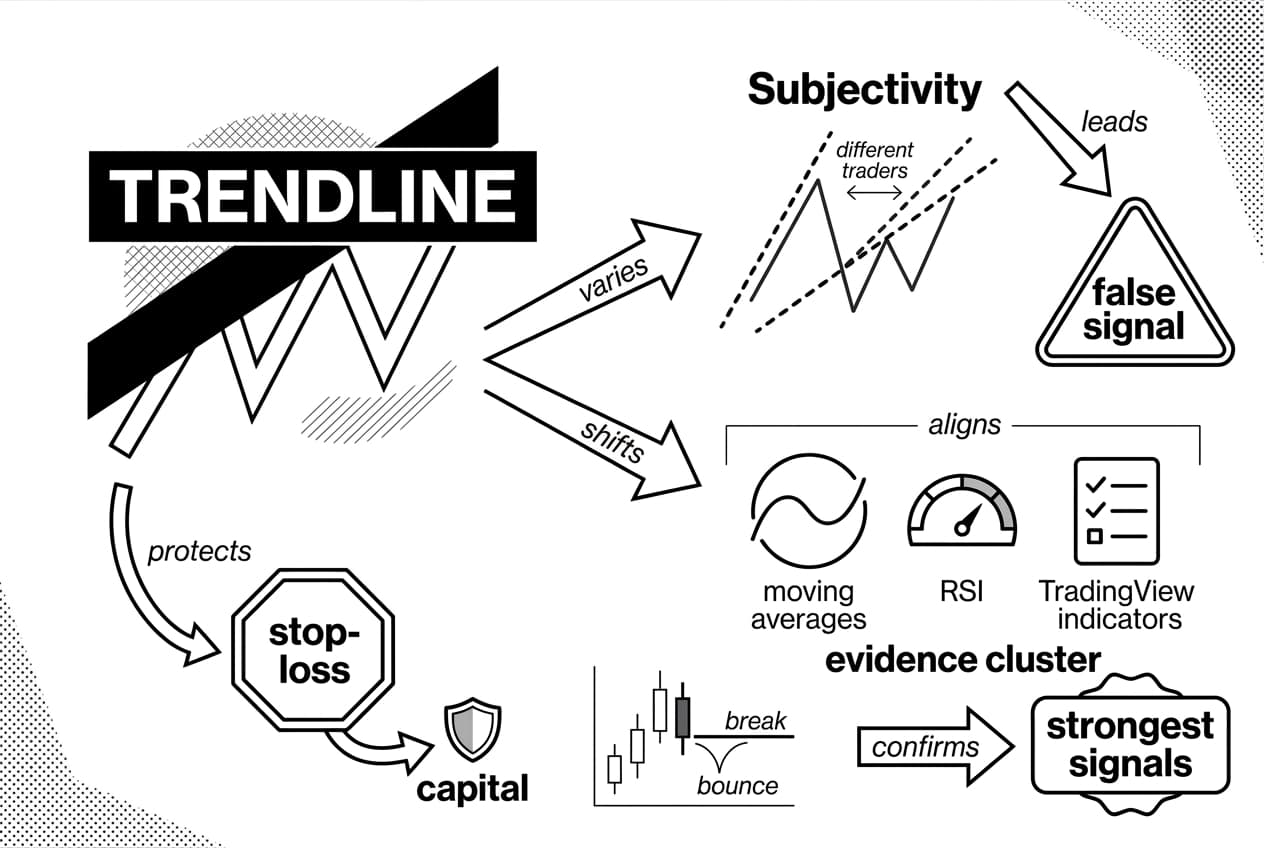
To improve your success rate in trendline trading, never rely on them in isolation. The strongest signals occur when a trendline analysis aligns with other technical indicators. Think of it as gathering evidence. You might combine your trendline with moving averages to confirm momentum or use the Relative Strength Index (RSI) to spot overbought or oversold conditions. Finding the right combination of the best TradingView indicators can significantly strengthen your strategy.
Finally, always practice sound risk management. Every trade you take, whether based on a trendline break or bounce, should have a predefined stop-loss. This protects your capital if the market moves unexpectedly against you. A perfect trendline is no substitute for a solid trading plan.
Frequently Asked Questions
- What is trendline trading?
- Trendline trading is a technical analysis technique where lines are drawn on a chart to connect price points, revealing the market's direction. These lines act as dynamic support or resistance levels. Traders use these visual guides to identify potential entry and exit points in line with the prevailing trend.
- How profitable is trendline trading?
- The profitability of trendline trading varies greatly and is not guaranteed. Success depends more on a trader's discipline, risk management, and ability to read market context than the strategy itself. While many traders find trendlines effective, they are a tool for analysis, not a standalone formula for profit.
- What is the 5-3-1 rule in trading?
- The 5-3-1 rule is a risk management framework, not a trendline-specific strategy. It generally advises risking no more than 5% of your total capital at once, targeting a 3:1 reward-to-risk ratio on your trades, and limiting the risk on any single trade to just 1% of your account.
- How accurate are trendlines?
- Trendline accuracy is subjective and not absolute. A line with more validated touchpoints is generally considered more reliable. They serve as a guide for potential price reactions, not as infallible predictors. For best results, traders should use trendlines in conjunction with other indicators and confirmation signals to improve their analysis.
Sources
Author

Crypto analyst and blockchain educator with over 8 years of experience in the digital asset space. Former fintech consultant at a major Wall Street firm turned full-time crypto journalist. Specializes in DeFi, tokenomics, and blockchain technology. His writing breaks down complex cryptocurrency concepts into actionable insights for both beginners and seasoned investors.


