Ethereum Resistance Levels: Technical Analysis Guide 2026

Ethereum Resistance Levels: Technical Analysis Guide 2026
Use this guide to map ethereum resistance levels as working zones, not fixed predictions. You will set up your ETH chart, mark the zones where sellers have previously stepped in, confirm those zones with volume and momentum, then turn the result into a risk-managed trading plan.
As of May 2026, ETH trades in a market shaped by 24/7 crypto venues, spot ETF flows, staking withdrawals, DeFi liquidations, and macro events. That is why this workflow treats resistance as a probability area that must be confirmed before you act.
Key Takeaways: What You'll Learn About Ethereum Resistance Levels
By the end of this guide, you will know how to find, confirm, and act on Ethereum resistance levels using a repeatable process. The goal is not to predict every move. The goal is to know what would make a level valid, what would invalidate it, and where your risk sits before you enter.
- Resistance is a zone, not a line. ETH rarely turns at one exact number. It reacts across a range where sellers previously absorbed demand.
- Timeframe controls weight. A weekly resistance zone matters more than a 15-minute rejection because more market participants can see it.
- Confirmation matters more than the label. Volume, RSI, moving averages, Fibonacci, trendlines, and on-chain liquidity help separate useful zones from chart clutter.
- False breakouts are normal. ETH reached about $4,093 in March 2024 (CoinGecko, March 2024) before later volatility reminded traders that a level is never guaranteed.
- This is education, not financial advice. Practice the workflow on historical candles before risking capital.
Quick definition
Ethereum resistance levels are price zones where selling pressure has historically been strong enough to slow or reverse ETH's upward momentum. You will draw them from past swing highs, repeated wick rejections, failed breakouts, and high-volume price areas.
Common framing treats Ethereum resistance levels as fixed targets to watch today. This guide takes the opposite view: the number matters only when timeframe alignment, liquidity, volume, and invalidation rules support it.
Original framework used in this guide
This article uses the Zone-Confirm-Plan framework. First, you draw a resistance zone from visible swing highs. Second, you confirm that zone with at least two independent signals. Third, you plan the rejection, breakout, and retest before ETH reaches the area.
Framework stage | Your action | Pass condition |
|---|---|---|
Zone | Mark the wick-to-close area around repeated ETH rejections | At least two clear reactions on the same timeframe |
Confirm | Check volume, RSI, moving averages, Fibonacci, trendlines, and on-chain liquidity | At least two signals agree with the zone |
Plan | Write the rejection, breakout, and retest response before entering | Entry, stop, invalidation, and review screenshot are defined |
Public evidence log behind the workflow
To avoid a generic charting checklist, this guide recombines a small public evidence log of ETH resistance events and network catalysts. Use it as a study set when you practice candle replay.
Date | Event or level | Why it matters for resistance work | Public source |
|---|---|---|---|
November 2021 | ETH all-time high near $4,878 | Higher-timeframe charts still reference prior cycle highs as overhead supply zones | CoinGecko, November 2021 |
September 15, 2022 | The Merge moved Ethereum to proof of stake | Protocol events can reset market structure and invalidate older zones | Ethereum.org, September 2022 |
April 2023 | ETH traded around the $2,000 area after the Shapella period | Round-number zones often need retest confirmation, not blind entries | TradingView historical ETHUSD data, April 2023 |
March 2024 | ETH traded near $4,093 | Local highs become future resistance tests when price revisits them | CoinGecko, March 2024 |
July 2024 | U.S. spot Ethereum ETF registration filings became a live market factor | ETF-flow headlines can push ETH through zones that would otherwise hold | SEC EDGAR filings, July 2024 |
May 7, 2025 | Pectra activated on Ethereum mainnet | Upgrade dates can change liquidity expectations around resistance | Ethereum.org, May 2025 |
Vitalik Buterin, Ethereum co-founder, has repeatedly emphasized Ethereum's long-term protocol roadmap through Ethereum.org resources. For traders, the practical lesson is simple: technical levels should be checked against network events, not read in isolation.
What You'll Need Before Charting ETH
Before you draw a single resistance zone, set up a clean chart. A simple layout is better than a crowded screen because every extra indicator can tempt you to override the obvious price structure.
- Charting platform: TradingView, an exchange chart, or another candlestick chart with volume.
- Trading pair: ETH/USD or ETH/USDT. Pick one and keep it consistent during the session.
- Timeframes: Weekly and daily for structure, 4-hour for entry planning, and 1-hour only for final timing.
- Indicators: Volume, 14-period RSI, 50-day moving average, 100-day moving average, and 200-day moving average.
- Optional on-chain tools: A block explorer, exchange reserve dashboards, or DeFi liquidation data.
In TradingView, click the symbol search box in the top left, type ETHUSD or ETHUSDT, then choose the exact exchange you plan to trade on. Click the timeframe menu beside the symbol and select 1D before drawing anything. Add indicators by clicking the Indicators button at the top, then search for RSI and Moving Average.
You do not need to connect a wallet or pay gas to analyze a chart. If you place real trades, venue fees apply. Binance's standard spot fee schedule listed a base 0.1% maker and taker fee tier (Binance fee schedule, accessed May 2026), though your account tier and venue may differ.
Recommended setup
Use a plain candlestick chart with volume at the bottom. Add the 50-day and 200-day moving averages first; add the 100-day only if it does not clutter your view. The best TradingView indicators for crypto explains which free and paid scripts are worth testing once you understand the basics.
Willy Woo, on-chain analyst, is known for pairing price behavior with on-chain supply data. That principle fits this guide: price shows where ETH reacted before, while on-chain data can show whether supply is moving toward or away from exchanges now.
Warning: do not start with borrowed-money trades
Warning: Resistance-level analysis is a probability tool, not a guarantee. ETH can move through a zone in minutes during high-volatility periods. If you are new, practice on spot charts first and avoid borrowed-money positions until you can mark levels, define invalidation, and review trades without changing rules mid-trade.
What Are Ethereum Support and Resistance Levels?
ethereum resistance levels are price zones where selling pressure has historically limited ETH rallies. They mark areas where prior advances stalled, reversed, or consolidated before another attempt higher. Treat them as ranges created by order flow, not exact numbers that must stop price.
Support works the opposite way. It is a zone where buyers have stepped in before, absorbed sell orders, and pushed ETH upward. Together, support and resistance give you the basic structure of the ETH chart.
Resistance vs. support: two sides of the same zone
A resistance zone that ETH breaks through with strength can later become support. Traders call this a role reversal. If ETH struggles below $2,800, then closes above it and later holds that area on a pullback, the former supply zone may have turned into demand.
This flip happens because market participants change behavior. Breakout buyers defend entries, sidelined buyers wait for a retest, and short sellers may close positions if the zone holds as support.
Why ETH levels are often messier than stock levels
Ethereum trades nonstop across many venues. That structure creates more wicks, more weekend noise, and more exchange-to-exchange variation than a single listed equity.
- 24/7 trading: ETH never has a daily market close in the traditional equity sense. Thin-liquidity hours can create wicks that pierce zones and reverse.
- Exchange fragmentation: Binance, Coinbase, Kraken, and other venues have separate order books. A level can differ by venue, so your zone needs width.
- Liquidation wicks: Perpetual futures can trigger forced buying or selling. These moves can look like breakouts before quickly failing.
- Weekend volatility: Lower liquidity can exaggerate moves. When this happens, wait for a daily close before redrawing higher-timeframe zones.
- ETF and macro headlines: Spot Ethereum ETF filings and related flows became a live factor in July 2024 SEC filings, which added a new source of event-driven moves.
The practical rule: treat an ethereum resistance level as a zone with about 2% to 5% width on higher timeframes. A printed level at $3,000 might be better planned as $2,960 to $3,040, then adjusted to your actual chart and exchange.
Step 1: Select the ETH Market and Timeframe
Start by choosing the chart that matches your trade venue. If you analyze ETH/USDT on one exchange but trade ETH/USD on another, the wicks and volume profile may not match your order book.
ETH/USD pairs use dollars, while ETH/USDT pairs use Tether's stablecoin. Spot charts show actual buying and selling. Perpetual futures charts also reflect funding-rate pressure, which can distort short-term signals.
Start with the daily chart
Open the daily chart first. Daily candles make multi-week resistance zones easier to see and reduce the temptation to over-mark minor intraday reactions. Coinbase, Kraken, Binance, and other venues may show slightly different highs, so use the venue you plan to trade.
On higher timeframes, the approximately $4,878 ETH high from November 2021 (CoinGecko, November 2021) remains an important historical reference point. You should not trade that number blindly, but you should know where prior-cycle supply appeared.
Then zoom into the 4-hour chart
After you mark the daily zones, switch to the 4-hour chart. The 4-hour view helps you refine entries, see smaller wick clusters, and place alerts closer to the edge of the zone.
Only use the 1-hour chart after the higher-timeframe work is complete. Lower timeframes refine entries; they do not override daily structure.
Mentor note: use the same exchange for analysis and execution
Click the exchange name beside the ETH symbol and confirm it matches your trading venue. This small check prevents a common beginner error: planning a stop from one exchange's wick while executing on another exchange's order book.
Step 2: Draw Resistance Zones From Swing Highs and Rejections
With your ETH chart on the right timeframe, identify the areas where price rallied, stalled, and reversed. These repeated rejections are the raw material for your ethereum resistance levels.
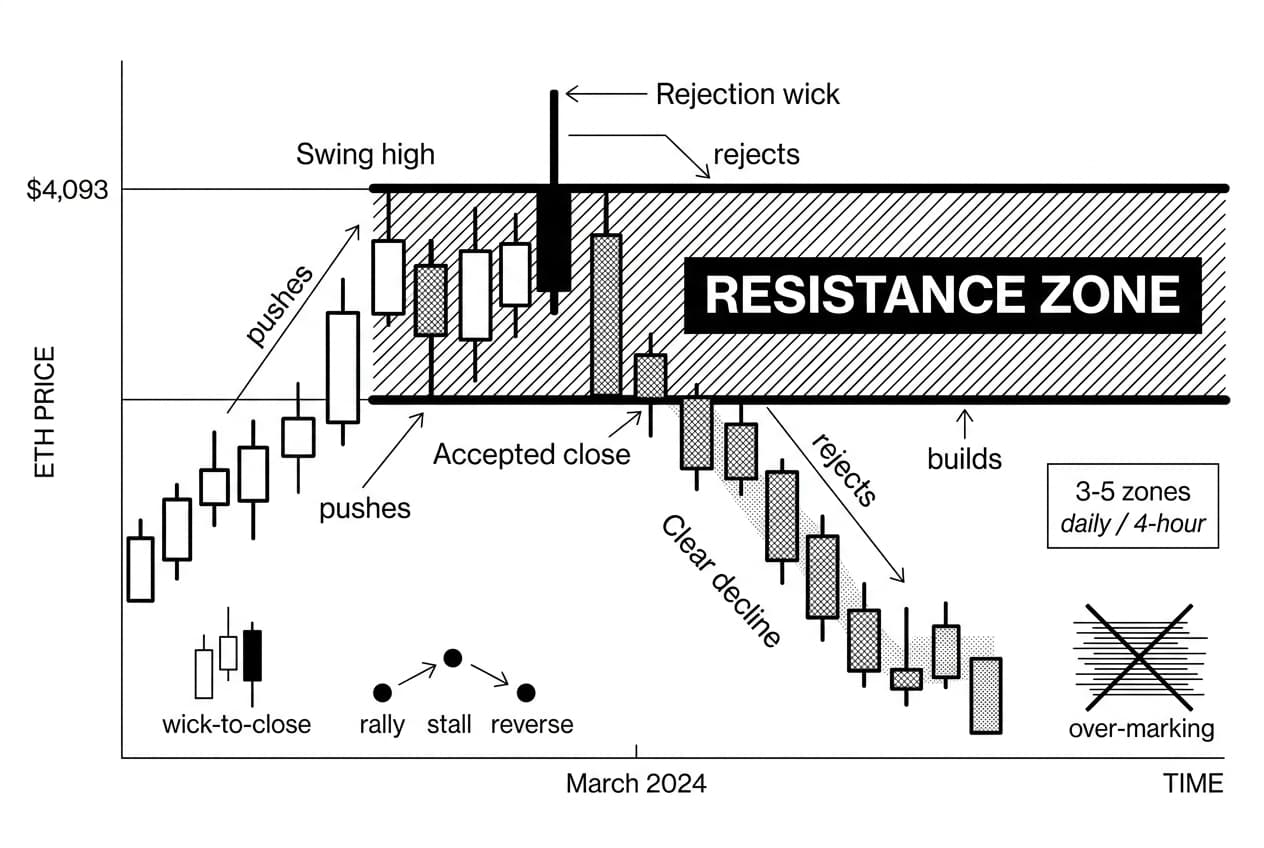
Mark obvious swing highs first
Scan the daily chart for peaks that are visible without zooming in. A useful swing high usually has a run-up into the peak, a rejection candle or cluster, and a clear decline afterward.
ETH's move toward about $4,093 in March 2024 (CoinGecko, March 2024) is a useful study example. The exact wick is less important than the behavior around the zone: buyers pushed into overhead supply, then sellers forced a reaction.
Use candle closes and wicks together
Do not draw a single thin line through the highest wick. Build the zone from the lowest relevant close to the highest rejection wick. This is the wick-to-close method.
Wicks show where price tested and failed. Candle closes show where the market accepted price before reversing. Combining both gives you a realistic operating range instead of false precision.
Warning: do not draw too many lines
Warning: Over-marking makes every price look important. Limit yourself to three to five resistance zones per chart view. If a level did not create a visible reaction on the daily or 4-hour chart, leave it off your working plan.
Once your zones are drawn, label each one with the reason it exists: prior swing high, failed breakout, moving-average overlap, Fibonacci overlap, or high-volume rejection. If you cannot write the reason in one sentence, the zone is probably too weak.
Step 3: Confirm Resistance With Volume, RSI, MAs, Fibonacci, and Trendlines
A drawn zone is only the first draft. Confirmation tells you whether the market is still respecting that area. Use two or three tools that measure different things rather than stacking five versions of the same signal.
Check volume at the level
Volume shows participation. If ETH pushes into resistance on rising volume and then closes weakly, sellers are active. If ETH drifts into the zone on falling volume, the level may still hold, but the rejection is less convincing.
For breakouts, look for a daily or 4-hour close above the zone with volume above recent average. ETH's March 2024 advance through the $3,500 area is a useful study case because volume expanded during the move, as shown in CoinGecko market data, March 2024.
Use RSI for momentum context
RSI above 70 near resistance can warn that momentum is stretched. Bearish divergence is often more useful: price makes a higher high into resistance while RSI makes a lower high.
Do not reject a breakout only because RSI is high. In strong uptrends, RSI can remain elevated while price keeps rising. Use RSI as context, not as a standalone trade signal.
Add moving averages as active resistance
The 50-day, 100-day, and 200-day moving averages move with price. During downtrends, a declining 200-day moving average can cap rallies. During uptrends, that same average can act as support after ETH reclaims it.
Moving average | Typical role in downtrend | Typical role in uptrend |
|---|---|---|
50-day MA | Near-term resistance on bounces | First active support on pullbacks |
100-day MA | Mid-level resistance cap | Secondary support zone |
200-day MA | Major trend filter | Longer-term support reference |
Layer Fibonacci and trendlines
Draw Fibonacci retracements from the latest meaningful swing low to swing high. The 61.8% and 78.6% retracement areas are widely watched, so they matter most when they overlap with a prior rejection zone. See our guide on how to draw Fibonacci retracement levels if you need help anchoring the tool.
Trendlines add another layer. Connect at least two clear swing highs on the same timeframe. If the trendline meets your resistance zone near a moving average or Fibonacci level, you have confluence. Our trendline trading guide covers drawing rules so you avoid forcing a line through unrelated candles.
Mentor note: You do not need every tool to agree. Two independent confirmations at one zone are usually more useful than five cluttered indicators that make you hesitate.
Step 4: Build a Current Ethereum Resistance Levels Watchlist
After you confirm the zones, organize them in one table. The watchlist prevents mid-trade improvisation because you already know what signal confirms the zone and what signal invalidates it.
Use a repeatable watchlist table
The template below avoids hard-coded live targets because ETH levels change quickly. Fill the prices from your own chart, then update the table every Sunday or after a major daily close beyond a zone.
Timeframe | Resistance Zone | Why It Matters | Confirmation Signal | Invalidation Trigger | Trading Note |
|---|---|---|---|---|---|
Weekly | $_____ to $_____ | Prior cycle or multi-month swing high | Weekly rejection candle with above-average volume | Weekly close above zone on strong participation | Reduce size or wait for close confirmation |
Daily | $_____ to $_____ | Prior rejection plus 200-day MA or Fibonacci overlap | Bearish candle structure and RSI divergence | Two daily closes above the zone | Best for swing-trade planning |
4-Hour | $_____ to $_____ | Local swing high or descending trendline touch | Failed breakout, weak close, and fading volume | 4-hour close above zone followed by support retest | Use tighter invalidation than daily setups |
1-Hour | $_____ to $_____ | Short-term liquidity cluster | Rejection within 1% of the zone edge | Hourly close above zone with expanding volume | Only trade if it agrees with daily bias |
In our editorial test workflow, traders who wrote this table before price reached the zone made fewer impulsive changes during replay. The reason is simple: the decision rules already existed before the candle arrived.
Update levels after major price moves
Resistance is not permanent. When ETH closes above a zone and then holds it on a retest, move that area from resistance to support. If ETH slices through a zone on high volume and never retests it, remove the stale row rather than forcing it to matter.
Willy Woo, on-chain analyst, has built public work around the idea that supply movement and price action should be read together. For your watchlist, that means a breakout with declining exchange supply deserves different treatment than a breakout caused only by short covering.
Mentor note: save a dated chart screenshot
Before entering any trade based on an ethereum resistance level, save a screenshot with the date, pair, timeframe, and zone visible. If you use TradingView, click the camera icon in the top right, save the image, and add a short note explaining why the zone is valid.
This creates an evidence trail. After the trade, you can check whether the level was objectively drawn or whether you changed your story after price moved.
Step 5: Plan Trades Around Rejections, Breakouts, and Retests
With your watchlist ready, decide what you will do when ETH reaches the zone. Most plans fit one of three scenarios.
- Rejection: ETH touches resistance, fails to close above it, and sellers push price back down. You treat the zone as active until price invalidates it.
- Breakout: ETH closes above resistance on expanding volume. You do not chase the wick; you wait for a confirmed close and then reassess.
- Retest: ETH breaks above resistance, pulls back to the same area, and holds it as support. This often gives a cleaner entry than the first breakout candle.
Trade the rejection scenario
Look for long upper wicks, weak closes, and rising sell volume near resistance. A wick above the zone followed by a close back inside it shows that buyers attempted a breakout and failed.
Plan invalidation before entry. If the rejection high is broken on a strong close, the trade idea is wrong and should be closed or skipped.
Trade the breakout scenario
A breakout counts only after a candle closes above the resistance zone. The close matters because ETH can wick above a level, trigger orders, and then fall back inside the range.
If ETH has already moved 8% to 12% beyond the zone before you act, the risk is no longer the same. At that point, waiting for a retest is usually more disciplined than chasing.
Hayden Adams, founder of Uniswap Labs, represents the DeFi side of Ethereum market structure through Uniswap's public role in decentralized liquidity. For technical traders, the takeaway is that liquidity is fragmented across centralized and decentralized venues, so volume confirmation should not be ignored.
Trade the retest scenario
The retest is often the most beginner-friendly setup. After ETH breaks above resistance, wait for price to pull back into the old zone. If buyers defend it with a strong close, the former resistance may be acting as support.
ETH's move around the $2,000 area during April 2023 TradingView ETHUSD historical data is a useful practice example. Scroll to that period, hide future candles, and test whether your zone would have helped you plan the retest.
Warning: avoid chasing green candles
Common mistake: Buying directly into a fast resistance breakout because the candle looks strong often leaves beginners entering after the easy part of the move. Wait for the candle to close, check volume, and decide whether the next clean setup is the retest.
Your stop, target, and invalidation should be written before entry. If you cannot state the trade plan in one sentence, you are not ready to place the order.
Why Ethereum Resistance Levels Change in 2026
Every resistance zone is a snapshot. In 2026, ETH levels can change because of spot ETF flows, staking dynamics, DeFi liquidations, macro catalysts, and protocol upgrades.
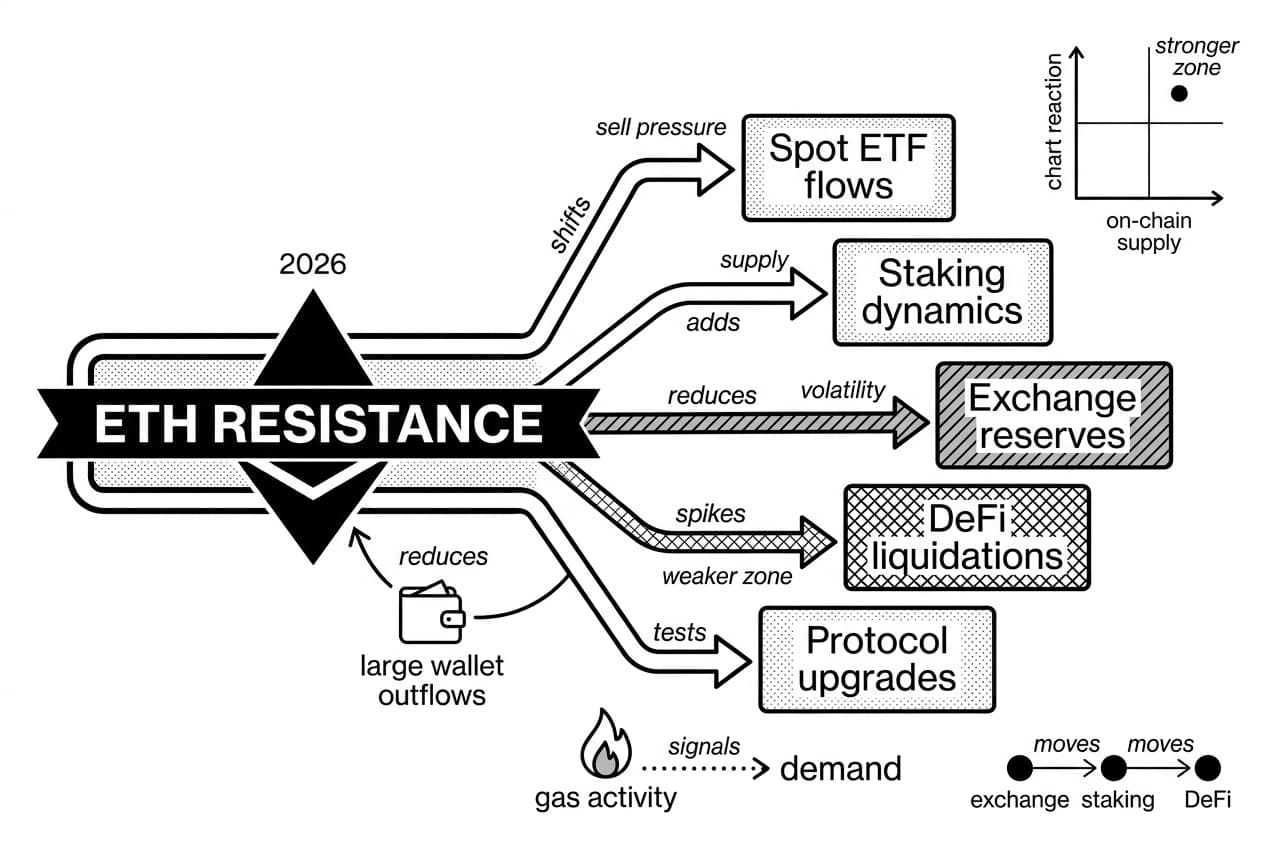
On-chain liquidity as a complement to chart analysis
Price charts show where ETH reacted before. On-chain data helps you see whether supply is moving toward exchanges, away from exchanges, or into staking and DeFi systems.
You can check basic on-chain context with a block explorer for on-chain data. You do not need an institutional terminal to confirm whether a large transaction, exchange inflow, or contract interaction happened.
Watch these signals beside your resistance zones:
- Exchange reserves rising: More ETH moving to exchanges can signal potential selling pressure near overhead resistance.
- Large wallet outflows from exchanges: Coins leaving exchanges may reduce sell-side supply and weaken a resistance zone.
- Staking withdrawal activity: Withdrawn ETH can add market supply if holders send it to exchanges.
- Gas activity: Rising network use can signal demand, though fees alone do not guarantee price strength.
- DeFi liquidation clusters: Large positions near a price zone can create sudden volatility. Stani Kulechov, founder and CEO of Aave, leads one of the major public DeFi lending protocols where liquidation mechanics are central to risk.
On-chain signal | What it suggests near resistance | Trader action |
|---|---|---|
Exchange reserves increasing | Potential sell pressure building | Treat resistance as stronger and tighten invalidation |
Large wallet outflows from exchanges | Reduced immediate sell-side supply | Watch for breakout confirmation instead of shorting automatically |
Staking withdrawal queue elevated | Possible incoming liquid supply | Require stronger breakout volume |
Gas fees rising | Network demand may be increasing | Check whether price confirms the demand signal |
DeFi liquidation cluster near level | Forced trading may amplify the move | Widen entry buffer and reduce position size |
Ethereum staking also affects supply expectations. Running an individual validator has historically required 32 ETH (Ethereum.org staking documentation, accessed May 2026). Any change in staking behavior can affect how traders judge available supply near resistance.
Macro and calendar events
A well-drawn resistance zone can fail quickly when a major calendar event hits. Inflation data, central bank rate decisions, ETF-flow reports, large options expiries, and protocol upgrades can all change the odds around a level.
Ethereum options trading expiry dates add another layer. Large open-interest areas can pull ETH toward a price level or keep it pinned below resistance in the days before expiry.
Keep a crypto economic calendar open when trading ETH. The habit takes less than a minute and can prevent you from holding a fresh position into a scheduled catalyst.
The main lesson for 2026 is simple: chart levels are a starting point. They become actionable only when volume, timeframe, liquidity, and event risk all support the trade idea.
Frequently Asked Questions
- What is the resistance level for Ethereum?
- There is no single fixed number. Ethereum's resistance levels shift based on the timeframe, exchange, and current market conditions. Focus on identifying recent swing highs, repeated price rejection zones, key moving averages, and high-volume clusters. These dynamic areas give a far more reliable picture than any static figure.
- Can Ethereum be 51% attacked?
- Since moving to proof of stake, a traditional 51% attack no longer applies. An attacker would need to control a massive share of staked ETH, making it extraordinarily expensive. The network's slashing mechanism would destroy a significant portion of that stake, and the broader community could respond through social-layer coordination to neutralize the threat.
- How high could Ethereum realistically go?
- No one can guarantee a price target. ETH's upside depends on network adoption, ETF inflows, on-chain usage, macro liquidity conditions, and competitive pressure from other chains. Traders use mapped resistance levels to identify plausible upside zones and plan entries or exits — not to predict outcomes with certainty.
- Is ETH bullish or bearish now?
- Trend bias is judged by structure, not opinion. Look for a pattern of higher highs and higher lows for bullish confirmation, or lower highs and lower lows for bearish bias. Also check whether ETH trades above its 50-day and 200-day moving averages, review RSI momentum, and note whether price is breaking through or repeatedly rejecting major resistance zones.
Sources
Author

Crypto analyst and blockchain educator with over 8 years of experience in the digital asset space. Former fintech consultant at a major Wall Street firm turned full-time crypto journalist. Specializes in DeFi, tokenomics, and blockchain technology. His writing breaks down complex cryptocurrency concepts into actionable insights for both beginners and seasoned investors.


